
How to Build a Reporting Dashboard in Odoo Dashboards: A Complete Guide
Muhammad Haroon
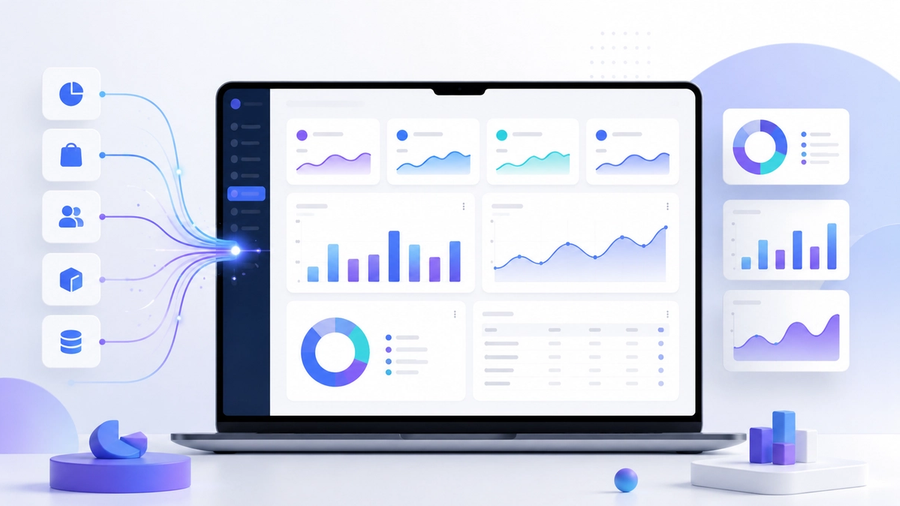
Getting useful insights from Odoo data shouldn't be difficult. As your business grows, it can be hard to keep track of data from sales, invoices, CRM, and other Odoo modules. Odoo Dashboards bring this data together in one place, so you can easily track performance, find trends, and make better decisions. For better reporting, you can create interactive dashboards with Odoo Dashboards. Now you must have one question in mind: How? Let’s show you how to build a reporting dashboard in Odoo Dashboards and turn your Odoo data into an interactive and filterable dashboard with AI-assisted reporting.
What Is Odoo Dashboards?
Odoo Dashboards, built by QuantyfAI, is a reporting tool that helps you turn your Odoo data into simple and useful reports. It works with data from sales orders, invoices, CRM, journal items, and other Odoo models. You can use this data to create dashboards with charts, filters, and other visual reports without writing code or waiting for a developer.
The idea is simple: every dashboard starts with a dataset. You create a dataset by bringing related fields from different Odoo models into one clean table.
Step 1: Build Your First Dataset
Before creating a dashboard, you need a dataset. A dataset is a collection of fields from your Odoo data, such as sales orders, invoices, or CRM records.
To create a dataset:
- Click New Data Set.
- Search for the Odoo model you want to use, such as Sales Order.
- Give the dataset a name and click Create Data Set.
A new dataset starts with the ID field and a few sample rows, so you can see how the data is structured. You can then add the fields you need, such as:
- Order Date
- Customer Name
- Customer Country
- Order Amount
- Order Status
You can also access information from related fields. For example, if an order is linked to a customer, you can pull the customer's name or country into the same dataset. This makes it easier to bring related information together without creating multiple reports.
Odoo Dashboards may give fields technical names such as Partner ID Name. You can rename them to simple names like Customer Name or Customer Country to make your dataset easier to understand and use.
Step 2: Create a Dashboard and Add Your First Item
Once your dataset is ready, you can start creating reports through Configurations > Dashboard Builder.
Click New Dashboard, give it a name, and start adding items. Each item can be a tile, chart, table, or note.
A tile is a simple way to start. Select your dataset, choose a metric, such as the sum of the untaxed amount, and add formatting like a currency symbol or thousands separator.
The result is a simple number showing your total sales from the available records.
Step 3: Build Charts
Charts work much like KPI tiles but they let you compare different data points. For example, you can create a Top 10 Customers bar chart by following these steps:
- Select your dataset.
- Choose Customer Name as the dimension.
- Choose Untaxed Sales Amount as the metric.
- Sort the results from highest to lowest.
- Set the limit to 10.
After saving the chart, you can easily resize or move it around the dashboard by unlocking the layout.
Step 4: Apply Filters
This is where Odoo Dashboards become more useful than a basic report. You can add filters in two ways:
Component-level filters work on one tile or chart. For example, you can add customer and date filters to a single tile without changing the rest of the dashboard. You can also give filters simple names and set default conditions, such as hiding cancelled orders.
Global filters work across the entire dashboard. Instead of adding the same filter to each chart or tile, you can set it once, and all dashboard items will update together.
In simple terms, component filters help you focus on one report while global filters let you view the entire dashboard based on a specific customer, region, or time period.
Step 5: Enable Advanced Metrics
Tiles and charts can show more than just the total. You can also display the count, minimum, maximum, and average values.
To enable this, go to the General tab and turn on Show Metrics. This lets one tile show multiple details at the same time. For example, you can see the number of orders, the smallest order, the largest order, and the average order value without creating separate tiles.
Step 6: Set Up Drill-Down
Sometimes, you need to see the records behind a number or chart. The drill-down feature lets you do this.
You can enable drill-down for a field, such as the ID field. Then, you can click a number or chart and view the individual records behind it. You can open these records in a list view or through the related Odoo model without going through the usual Odoo menus.
Step 7: Build Tables and Group Data
Tables give you a detailed view of your Odoo data. After selecting the Table type and your dataset, you can choose the columns you want to show, such as date, customer name, country, amount, and order status.
Tables support two useful behaviors:
- Grouping, either by default when the dashboard loads or interactively afterward. For example, group sales by country, customer, or other fields. You can even group by more than one field.
- Export, sending the table directly to Excel or PDF for reporting outside the dashboard.
Step 8: Add Custom Computed Fields and Conditional Columns
Odoo Dashboards can also help you avoid using Excel for simple calculations. You can create new values and organize your data directly in the dashboard.
Some useful options include:
- Computed fields: Create a new field using a formula. For example, you can multiply the order amount by a tax rate to calculate a Tax Amount.
- Conditional columns: Create rules to classify your data. For example, orders over $1,000 can be labeled Big Order, while smaller orders can be labeled Small Order.
- Summary tables: Group and summarize your data by fields such as customer and country. This can turn thousands of order records into a simple summary table.
- Custom date formatting: Change how dates appear in your tables to make them easier to read.
Step 9: Use the AI Feature to Auto-Generate Visualizations
Odoo Dashboards also has an AI builder that makes creating reports easier. Instead of setting up every option manually, you can simply describe what you want in simple language and the AI creates a visualization for you.
For example, you can ask the AI to:
- Show the top 10 customers by number of orders and only include confirmed orders.
- Create a table showing sales and average order value by customer.
- Add a last 40 days filter that updates automatically as time passes.
Before creating the report, the AI shows you what it plans to use, including the dataset, metrics, dimensions, sorting, and filters. You can review these settings and make changes before generating the visualization.
Common Questions About Building Dashboards in Odoo Dashboards
Do I need to know Odoo's data model to build a dashboard?
Some basic knowledge can help you choose the right model and fields. But the field picker and AI builder also helps to make the process easier, even if you're not familiar with Odoo's data model.
Can I reuse one dataset for multiple dashboards?
Yes. You can create a dataset once and use it in different tiles, charts, tables, and dashboards.
What's the difference between a component filter and a global filter?
A component filter narrows a single tile or chart. A global filter applies to every item on the dashboard at once, which is useful when you want to reframe the whole view around one customer, date range, or region.
Can I create fields that don't exist natively in Odoo?
Yes. You can create custom calculated fields and conditional columns directly in the dashboard builder without needing development work.
Is there a way to build dashboards without manually configuring every setting?
Yes. The built-in AI feature helps you describe the report you want in simple language, refine it through follow-up requests, and review the proposed configuration before it's generated.
Getting Started
Creating a dashboard in Odoo Dashboards is simple. You start by creating a dataset, then add charts, tables, tiles, filters, and metrics based on the data you want to track. You can also use the AI builder to create reports faster.
Since everything works from the same dataset, you can easily reuse your data and keep your dashboards organized and consistent.
If you want to see how it works, visit OdooDashboards.com and request access to the live demo.
See Odoo Dashboards in action
Start a free 7-day trial and build your first dashboard in minutes — or book a walkthrough and we'll show you how your team would use it.