
Odoo Analytics vs Excel: A Practical Comparison for Growing Companies
Muhammad Haroon
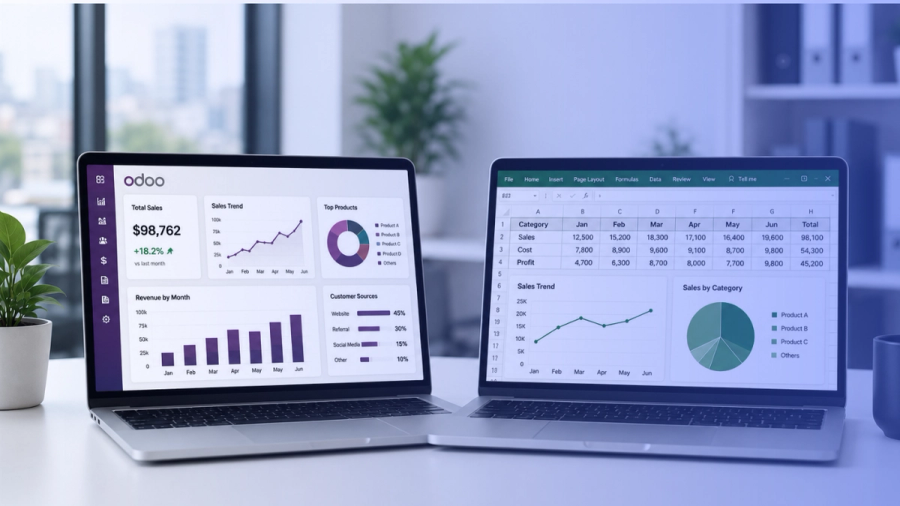
Almost all businesses first rely on Excel, which is a great tool for reporting. It is user-friendly, very cost-effective, and easy to use for everyone. But the problem arises when you scale up your business. Your team grows, sales increase, and multiple departments start working with the same data. Now ask yourself, “Can you manage dozens of spreadsheets? Can you manage who is updating the file, which version is updated, or which formulas are changed? Most probably, the answer will be no. That's why a real-time business intelligence tool like Odoo was needed.
Odoo analytics provides a structured way to handle the complexities of growing businesses that Excel can’t. For more clarity, let’s compare both Odoo analytics vs Excel solutions from a practical business perspective.
What Is Odoo Analytics?
Odoo Analytics is the reporting and business intelligence layer built into the Odoo ERP platform. Not only can it track features and costs, but it also helps manage expenses and income. Odoo Analytics reads data directly from the same database that runs your sales, inventory, accounting, HR, and manufacturing operations instead of manually combining it. You can easily track your revenue for specific projects or overall departments.
Even when transactions happen elsewhere in the system, all the reports, dashboards, and pivot views update automatically.
What Is Excel?
Excel is a general-purpose spreadsheet tool that contains columns and rows to structure the data. It doesn't natively connect to your business operations; it helps perform mathematical operations. Someone enters the data into it manually and then the reports are exported. You get access to formulas, pivot tables, charts, and macros all that a person is willing to build.
But Excel will do exactly what you tell it to and nothing more. It has no memory of your business processes and no awareness of what's happening anywhere else. Some challenges that large organizations face include scattered data, difficult version control, consuming valuable hours to manually update, and then errors becoming difficult to detect.
Side-by-Side Comparison
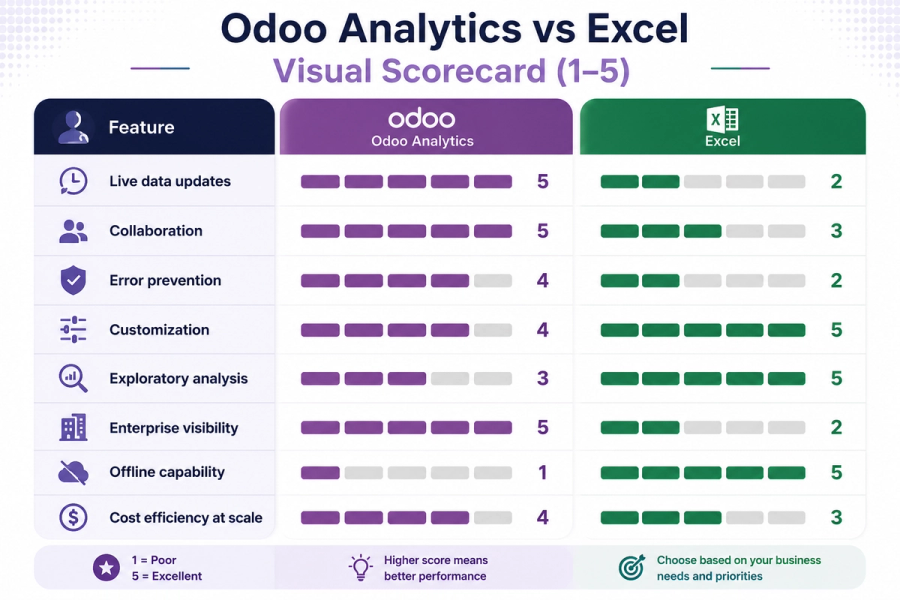
| Features | Odoo Analytics | Excel |
|---|---|---|
| Real-time data | Yes | No |
| Version control | Centralized | Manual |
| Cross-department reporting | Built-in | Manual |
| What-if analysis | Limited | Excellent |
| Offline use | No | Yes |
| Best for | Growing businesses | Ad hoc analysis |
Where Odoo Analytics Wins
It eliminates the "Which Version Is Correct?" Problem
In a spreadsheet-based company, it's common for the sales team, finance team, and leadership to each have a slightly different number for the same metric because each is working from a different export, taken at a different time, sometimes with different formulas. Odoo Analytics solves this by providing a solution where everyone can look at the same live dataset, so there's only one version for all.
Real-Time Decision-Making
Because Odoo Analytics is connected directly to operational data, a manager can see today's numbers, not last week's numbers reconstructed from a CSV export. For growing companies making frequent operational decisions like staffing, purchasing, and cash flow, this speed advantage becomes profitable quickly.
Fewer Manual Entry Errors
The maximum number of spreadsheet errors happens due to copy-paste mistakes, broken formula references, or someone typing a number into the wrong cell. Since Odoo Analytics pulls from validated transactional data rather than manual re-entry, this entire category of error is highly reduced.
Scales With the Business Automatically
A spreadsheet that works for 5 employees and 200 monthly transactions mostly becomes a great challenge for 50 employees and 10,000 transactions. Odoo Analytics is built on a database architecture designed to scale, so growth doesn't require rebuilding the reporting system from the start.
Built-In Cross-Functional Context
Because Odoo is a unified platform, analytics can combine data across departments without any extra integration work. A single dashboard can show how a marketing campaign affected sales, which affected inventory levels, which affected cash flow. These are the things that require huge manual work if managed in Excel.
Where Excel Still Wins
Exploratory, One-Off Analysis
If someone needs to test a hypothesis, build a quick financial model, or explore "what if we changed this one variable," then Excel is often faster and more flexible than building a new report inside any BI or ERP tool. Odoo Analytics is built for recurring and structured reporting, not rapid or freeform experimentation.
No System Dependency
Excel files work offline, don't require a subscription to a specific platform and can be opened by virtually anyone and anywhere. For small teams, contractors, or one-time projects, this universality is a real advantage.
Zero Learning Curve for Basic Use
Almost every business professional already knows the basics of Excel. Odoo Analytics requires some familiarity with how Odoo structures its data, like records, filters, or groupings, before it becomes intuitive.
Highly Customized, Non-Standard Reports
Some businesses need a report that doesn't map neatly to standard categories, like a highly specific investor model, a bespoke commission calculation, a scenario analysis with unusual variables. Excel's blank-canvas flexibility can outperform structured analytics tools here.
Practical Comparison Table
A Simple Framework: Which One Does Your Company Need?
Ask these four questions:
- Do more than 2–3 people need to see the same numbers regularly? If yes, then choose Odoo Analytics because shared and live dashboards remove version conflicts.
- Does your data live in more than one system (sales tool, accounting software, inventory tracker)? If yes, Odoo Analytics is best, as it's a unified platform that removes manual reconciliation.
- Do you need a one-time, highly custom analysis or model? If yes, choose Excel, where flexibility wins due to ad hoc work.
- Is your reporting need mostly static and small in scale (under a few hundred records)? If yes, Excel is probably still sufficient and you don't need to over-engineer.
Most growing companies don't need to choose only one. A practical approach is to use Odoo Analytics for daily business reporting and Excel for special analysis, forecasting, or one-time reports. When extra flexibility is needed, data can be exported from Odoo into Excel.
Best Hybrid Strategy (What Many Successful Companies Do)
A practical hybrid strategy used by many successful companies is to rely on Odoo for operational reporting like sales, inventory, invoices, and HR data while using Excel for specialized analysis such as forecasting, budgeting, and what-if scenarios.
In this approach, Odoo serves as the single source of truth for day-to-day business information, ensuring that everyone works with the same accurate data. When deeper analysis or custom modeling is needed, selected data can be exported from Odoo into Excel, allowing teams to take advantage of Excel’s flexibility without managing their entire reporting process through spreadsheets.
Transform Your Business Data into Actionable Insights with Odoo Dashboards
If you're spending hours updating spreadsheets or consolidating reports, you should rethink your reporting process.
By producing user-friendly, real-time dashboards that display crucial business data in one location, Odoo Dashboards enable companies to get more out of their Odoo ERP. Our dashboards provide you with a clear view of your operations so you can make quicker and more intelligent business decisions. Whether you want to monitor sales, finances, inventory, customer patterns, or important performance metrics, Odoo Dashboards is always here for you.
Get in touch with Odoo Dashboards right now to see how real-time reporting enables your business to grow confidently.
See Odoo Dashboards in action
Start a free 7-day trial and build your first dashboard in minutes — or book a walkthrough and we'll show you how your team would use it.