

Targets
A target plan holds the numbers you aim for: a sales target per team per month, a purchase budget per quarter, an order count per branch. A table widget can then show the plan as an extra column next to the real figures, with the difference and the percentage reached.
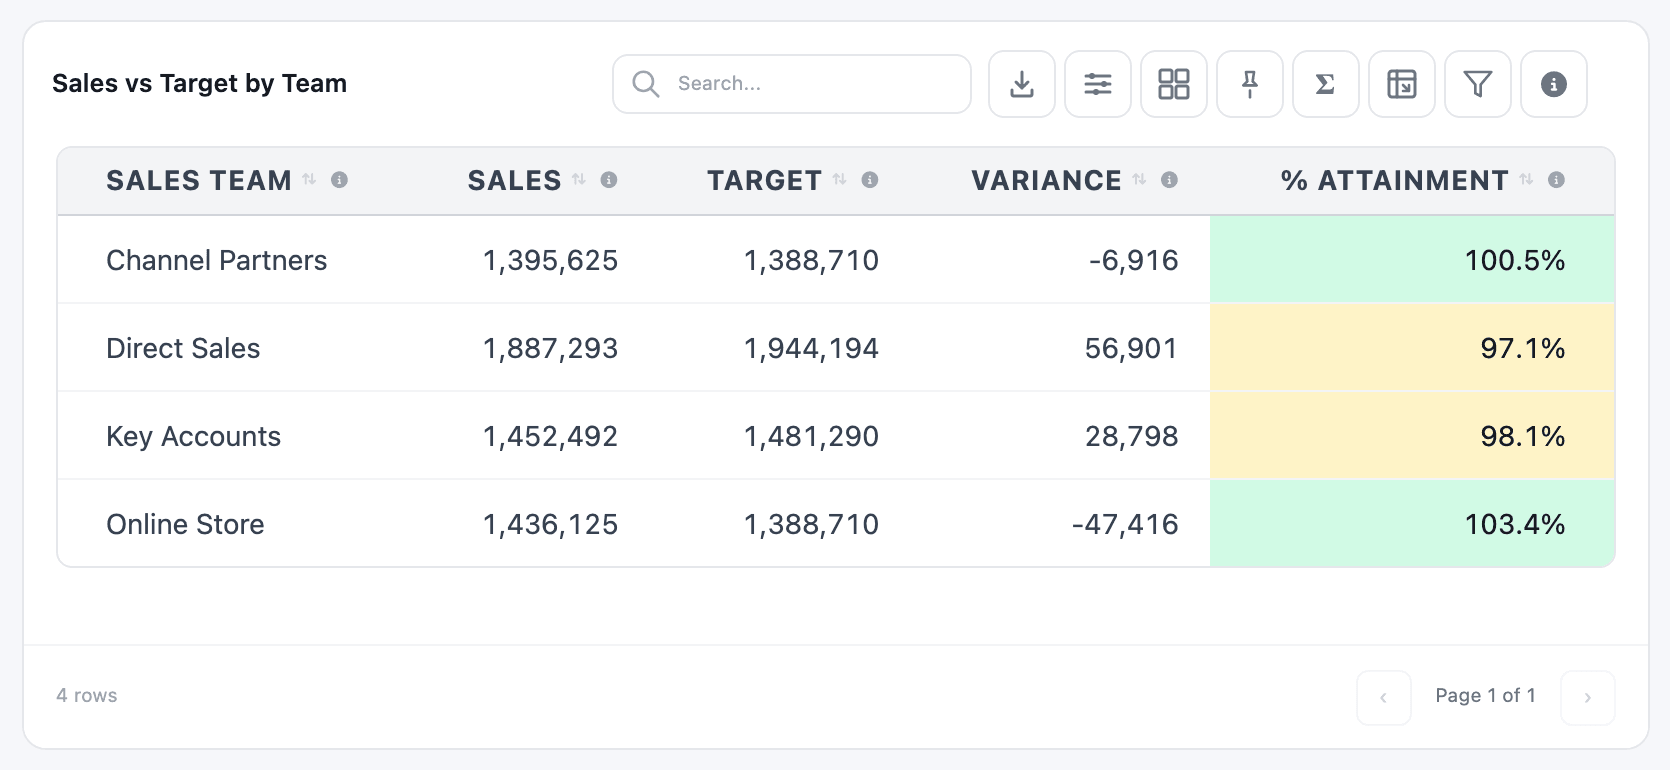
Targets work in three steps: create a plan, enter its numbers, and add it to a table.
Who can do it
Section titled “Who can do it”Creating and editing plans needs the Targets (SAAS) access right (see Sharing and access). It adds a Targets menu to Odoo Dashboards with two entries, Plan Targets and Target Plans. People without it still see targets on dashboards but can’t change them. A Dashboard Builder can add an existing plan to a table without this right.
1. Create a plan
Section titled “1. Create a plan”A plan always belongs to one dataset, the one that holds the actuals you compare against.
-
Go to Odoo Dashboards → Targets → Target Plans and click New.
-
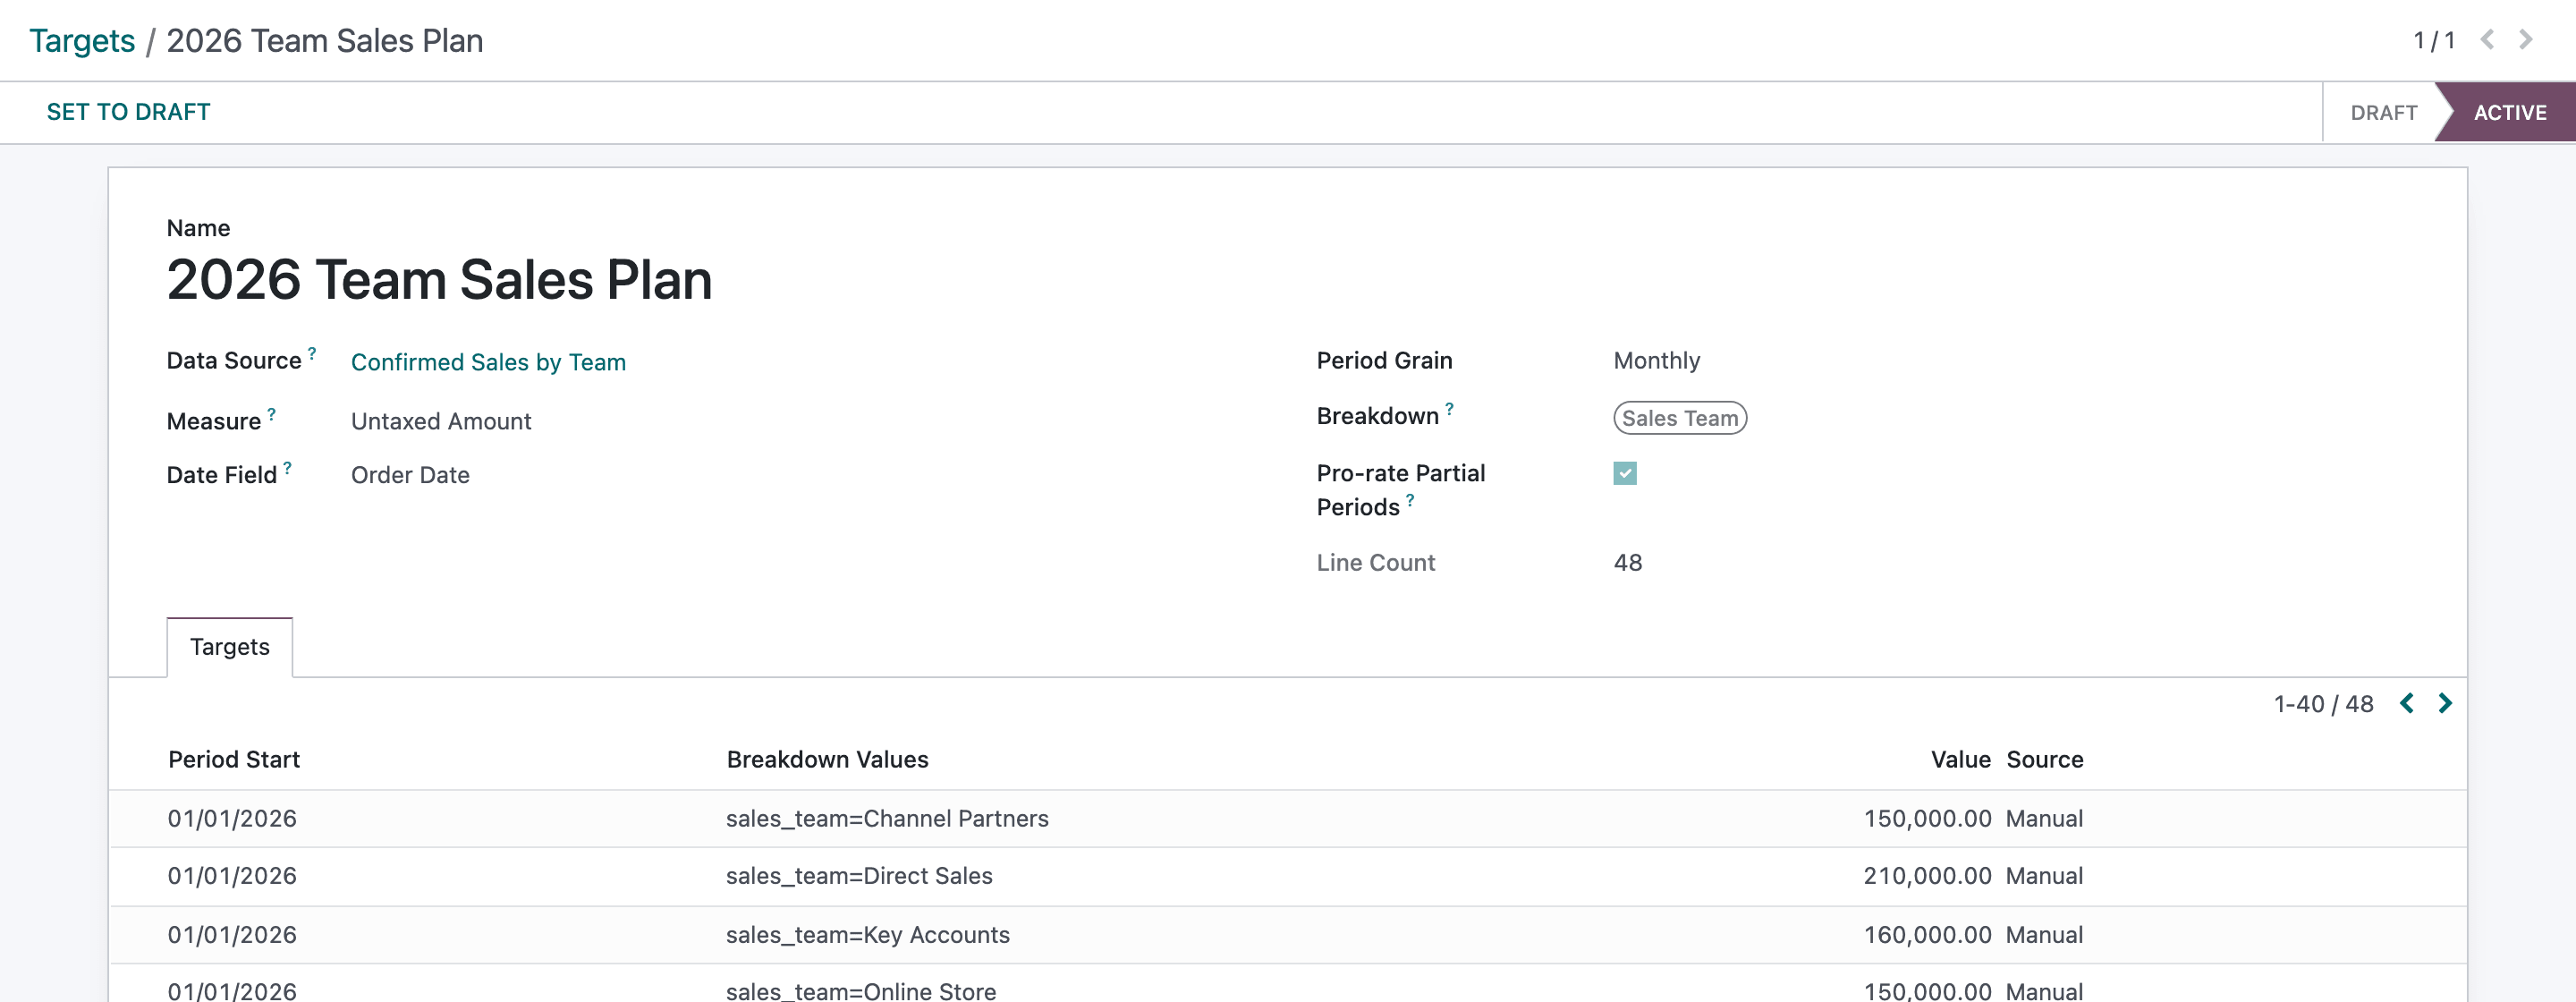
Give the plan a name, for example 2026 Team Sales Plan. The name also becomes the plan’s column name in tables (
target_2026_team_sales_plan), and that column name stays the same if you rename the plan later. -
Pick the Data Source: the dataset with the actuals.
-
Pick the Measure (what the target is a target of, such as the untaxed amount) and the Date Field (which date decides the period a record falls into, such as the order date). On a dataset built from an Odoo model, these pickers list the Odoo field paths (for example
price_subtotal) rather than the dataset’s column names. -
Choose the Period Grain: Monthly, Quarterly or Yearly.
-
Under Breakdown, pick the columns the target is split by, for example Sales Team. Leave it empty for a single company-wide target.
-
Keep Pro-rate Partial Periods ticked for amounts that build up over time, like sales. Untick it for levels such as stock on hand or headcount (see below).
-
Save, then click Activate. Only active plans can be used in tables.
Set to Draft takes an active plan off the dashboards and keeps its numbers. Tables with columns that use the plan then show an error (column “target_…” does not exist) until you activate it again or remove those columns.
2. Enter the numbers
Section titled “2. Enter the numbers”The Targets tab of the plan lists every target line (period start, breakdown values such as sales_team=Direct Sales, value). You can type lines there, but the grid is faster.
-
Go to Odoo Dashboards → Targets → Plan Targets.
-
Pick the plan under Target Plan, and set From and To to the periods you want to plan. The current calendar year is shown by default.
-
Type a number in each cell. The grid already lists the breakdown values found in your data (here, every sales team), so you don’t type names.
-
To repeat a value, type it in the first period and click Fill → at the end of the row: it copies the first value across every later period.
-
Click Save.

Clearing a cell or setting it to 0 deletes that target when you save. Only the periods visible between From and To are changed.
3. Show the plan in a table
Section titled “3. Show the plan in a table”Targets are available on Table widgets only.
-
In the Dashboard Builder, open a table that uses the plan’s dataset as its Data Source.
-
On the General tab, under Target Plans, tick the plan. The section only appears when the dataset has an active plan.
-
On the Configuration tab, add the target columns you need, using the plan’s column name in the expression (the builder shows ready-made ones, below).
-
Group the table by the plan’s breakdown column (here Sales Team) or by its date column, and click Save & Preview.
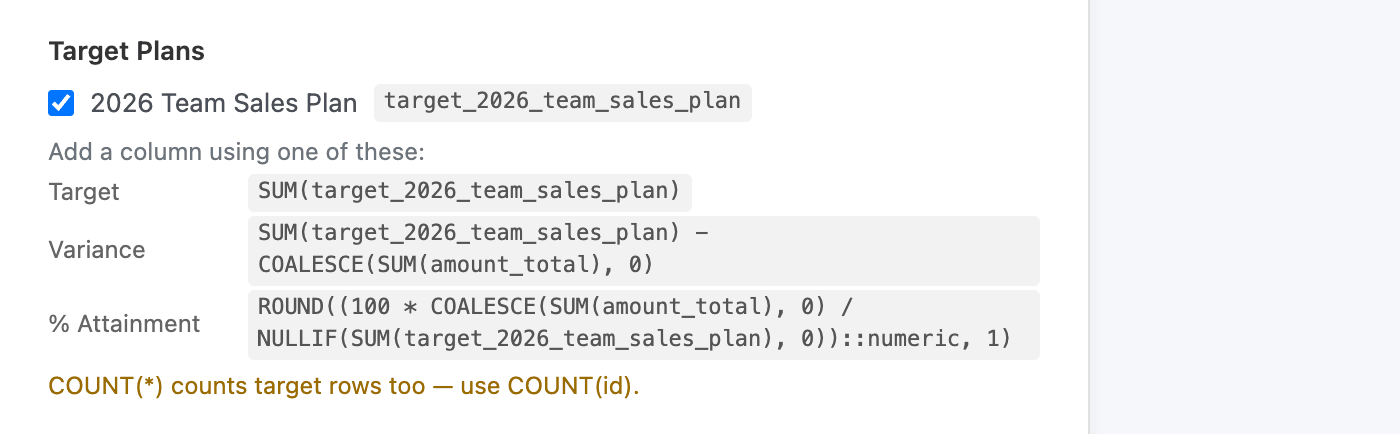
The expressions shown under the plan are a starting point:
| Column | Expression | Shows |
|---|---|---|
| Target | SUM(target_x) |
The target for each row of the table. |
| Variance | SUM(target_x) - COALESCE(SUM(measure), 0) |
Target minus actual: what is still to do. A negative number means the target is beaten. |
| % Attainment | ROUND((100 * COALESCE(SUM(measure), 0) / NULLIF(SUM(target_x), 0))::numeric, 1) |
Actual as a percentage of the target. |
To colour the attainment as in the example, add conditional formatting to the % Attainment column, for example green from 100, amber from 90 and red below.
Use SUM, and COUNT(id) instead of COUNT(*)
Section titled “Use SUM, and COUNT(id) instead of COUNT(*)”The plan’s numbers are added to the table’s data as extra rows. Two rules follow from that, and the builder refuses to save a table that breaks them:
COUNT(*)would count the target rows too. Count a real column instead, for exampleCOUNT(id).- With a pro-rated plan, the target column can only be summed (
SUM). Averages, minimums, maximums or counts of it would report a single day’s share.
How filters affect the target
Section titled “How filters affect the target”A target follows the table’s filters only on the columns the plan knows about: its date column and its breakdown columns.
- A filter on the date column narrows the target to the same dates. The example table has a “year to date” filter on the order date, so its targets run from 1 January to today.
- A filter on a breakdown column, such as one sales team, narrows the target to that team.
- A filter on any other column, for example a customer, narrows the actuals but not the target. The builder warns about this next to the plan (Not narrowed by customer — this target stays broader than the table.), and the dashboard shows the same warning on the affected column headers.
Pro-rating
Section titled “Pro-rating”With Pro-rate Partial Periods on, each period’s target is spread evenly over its days. A filter that covers 8 days of a 31-day month shows 8/31 of that month’s target. In the example, Channel Partners have 150,000 a month, so 1 January to 8 October gives 9 × 150,000 + 8/31 × 150,000 = 1,388,710.
With it off, a period counts in full or not at all, which suits levels such as a stock target.
A monthly plan also adds up correctly in a table grouped by quarter or year.
For a complete worked example, from the dataset to the finished table, see Sales vs target.
Target plans are not the same as the KPI Value field of a tile, which is one fixed number to show progress against. See Tiles.