

Custom fields
A custom field is a calculated column you add to one widget: an average price, a sales band, a share of the category, two fields joined into one. You build it in a wizard by clicking fields and operators, and the app writes the SQL.
Custom fields belong to the widget, not the dataset. They are worked out in that widget’s query, and another widget on the same dataset doesn’t see them. If many widgets need the same calculation, add it to the dataset instead (in custom SQL if a model dataset can’t express it).
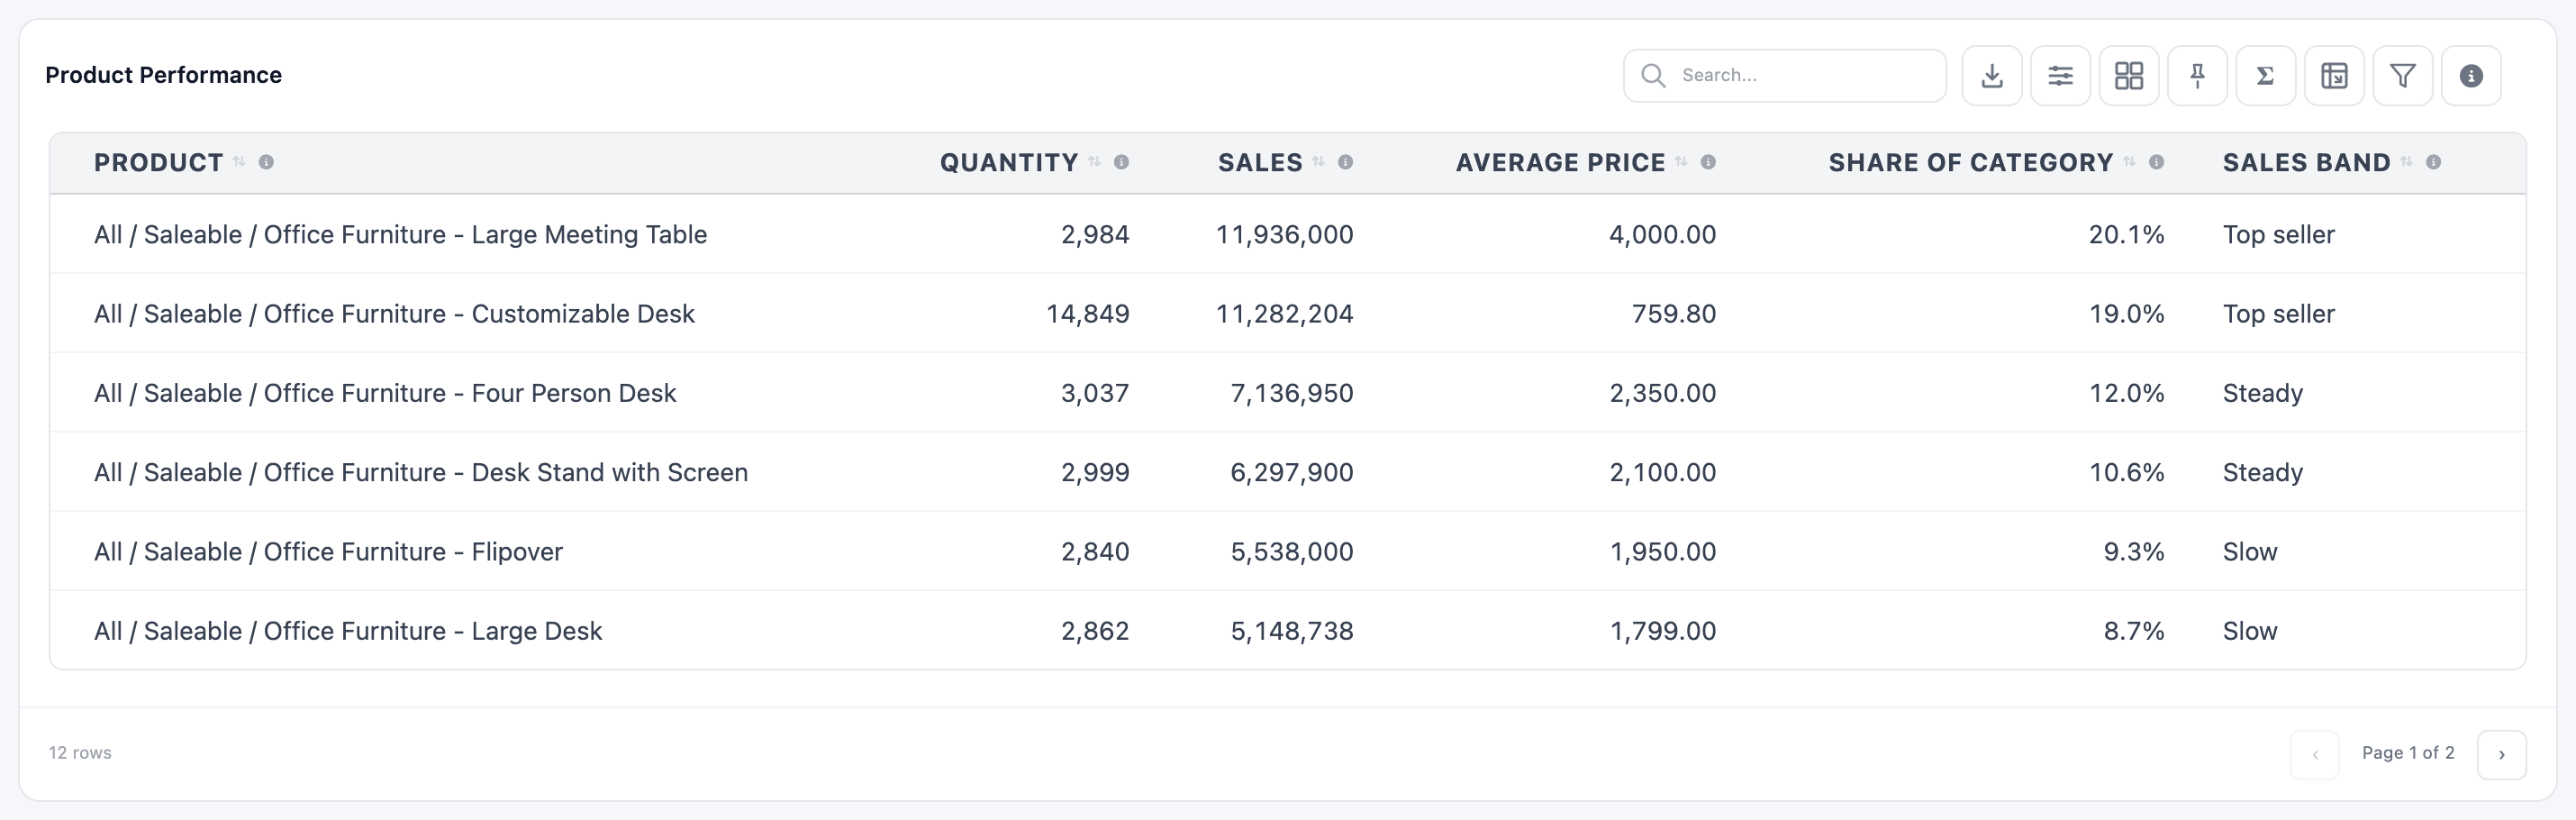
Open the wizard
Section titled “Open the wizard”Every field picker in the Dashboard Builder ends with Custom… (calculator icon). Pick it to create a custom field for that spot. When the picker already holds a custom field, Edit Custom Field opens it again.
-
In the Dashboard Builder, select the widget and open the Configuration tab.
-
Click the field picker you want to fill, for example a column’s field in Table Columns Configuration.
-
Scroll to the end of the list and pick Custom….
-
Build the field (see the modes below). On a table, also type a Field Label: it becomes the column header.
-
Click Apply, then Save & Preview.
Apply stays disabled until the field is complete; hover over it to see what’s missing. Cancel closes the wizard without changes.
Which modes each picker offers
Section titled “Which modes each picker offers”| Opened from | Modes |
|---|---|
| A table column | Arithmetic (with Remaining Quantity (FIFO) and Percent of Total (Share)), Condition, Format, Combine |
| A tile’s data field | Arithmetic, Condition, Format |
| A chart’s measure | Arithmetic, Condition, Format |
| A chart’s dimension | Condition only |
| A Matrix Report measure | Arithmetic, Condition, Format |
| A filter’s Filter By | Arithmetic, Condition, Format |
Only table columns have a Field Label. Elsewhere the widget’s own labels apply.
Arithmetic
Section titled “Arithmetic”Use it for any sum, difference, ratio or date calculation: average price, margin, days between two dates.
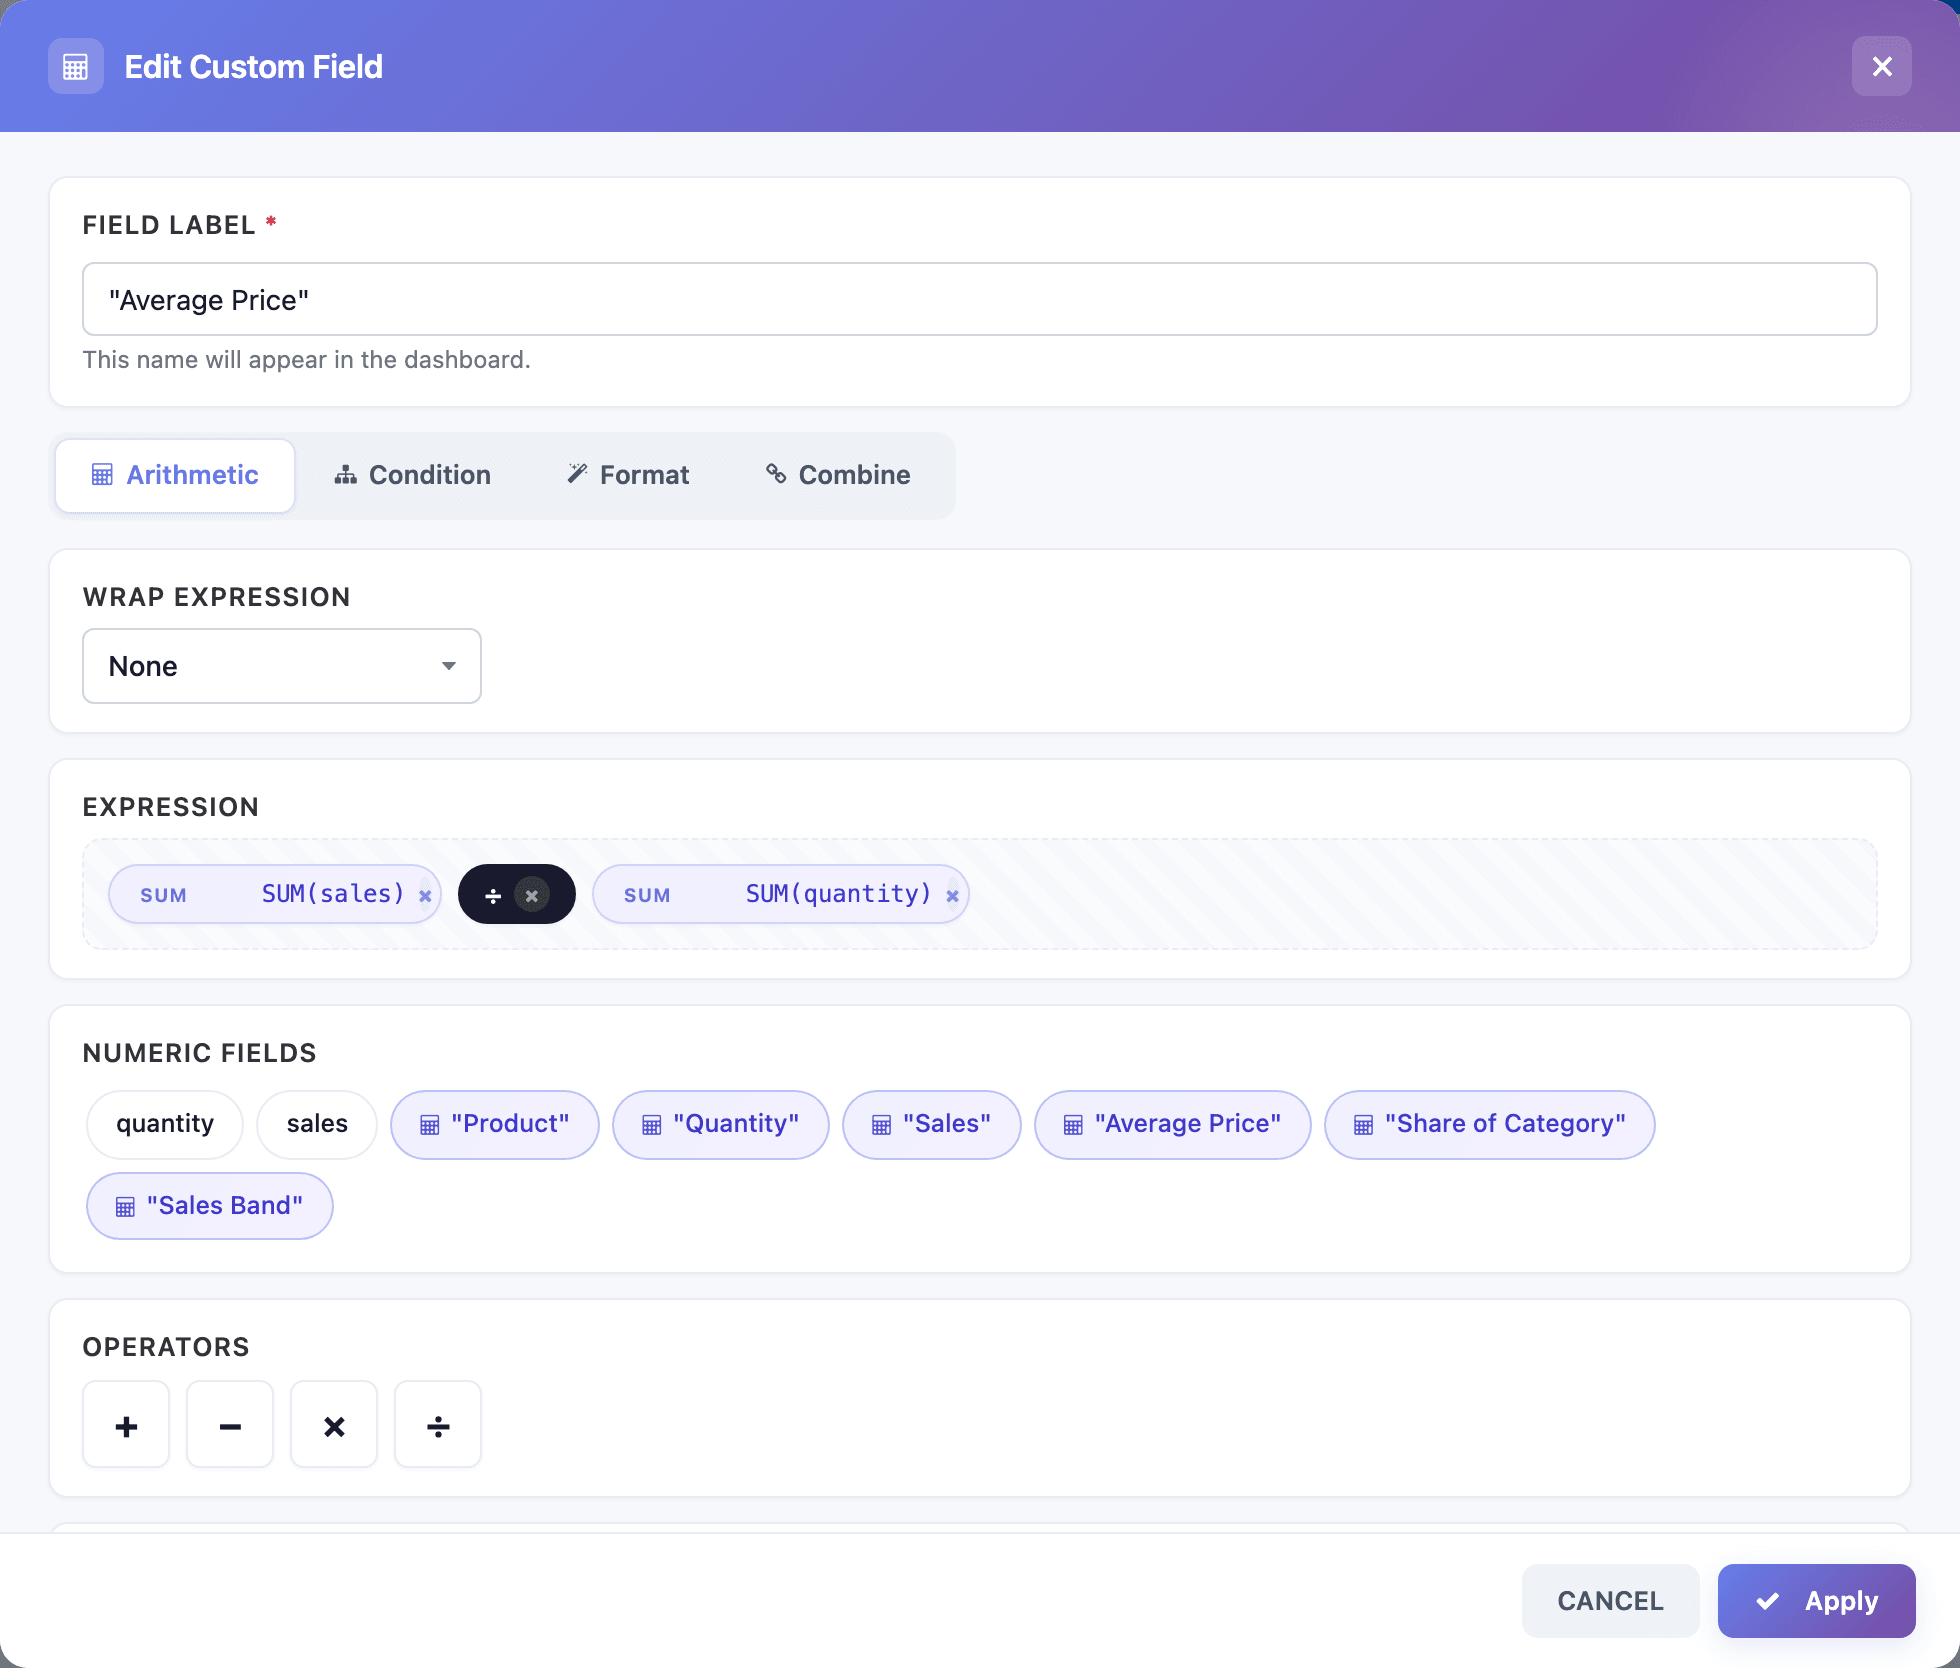
- Expression is built from left to right. Click a chip under Numeric Fields to add a field, an operator (+ − × ÷), or type a number under Numeric Value and click Add value. The × on a piece removes it.
- Each field in the expression has its own aggregation picker: none, SUM, AVG, MIN, MAX or COUNT. In a table that groups rows, aggregate every field, as in SUM(sales) ÷ SUM(quantity) above.
- Wrap Expression puts one aggregation around the whole expression, for example
SUM( quantity × price ). - Empty values count as 0.
- Date Tools (when the source has date fields) add intervals (Add INTERVAL), extract a part such as the month (Add EXTRACT), truncate to the start of a period (Add DATE_TRUNC), use NOW() or CURRENT_DATE, and compute the gap between two dates in days, months or years (Add difference).
- On a table with date filters, Date Filter Range inserts the picked Date from or Date to of one filter into the expression. With no range picked, they read as minus and plus infinity.
The wizard refuses expressions that end with an operator, have two operators in a row, or divide by the number 0.
Remaining Quantity (FIFO)
Section titled “Remaining Quantity (FIFO)”Tables only. It caps each row’s quantity at what is still available after the outflows of its group, in first-in-first-out order: for example how much of each purchase receipt is still in stock once all sales are taken out.
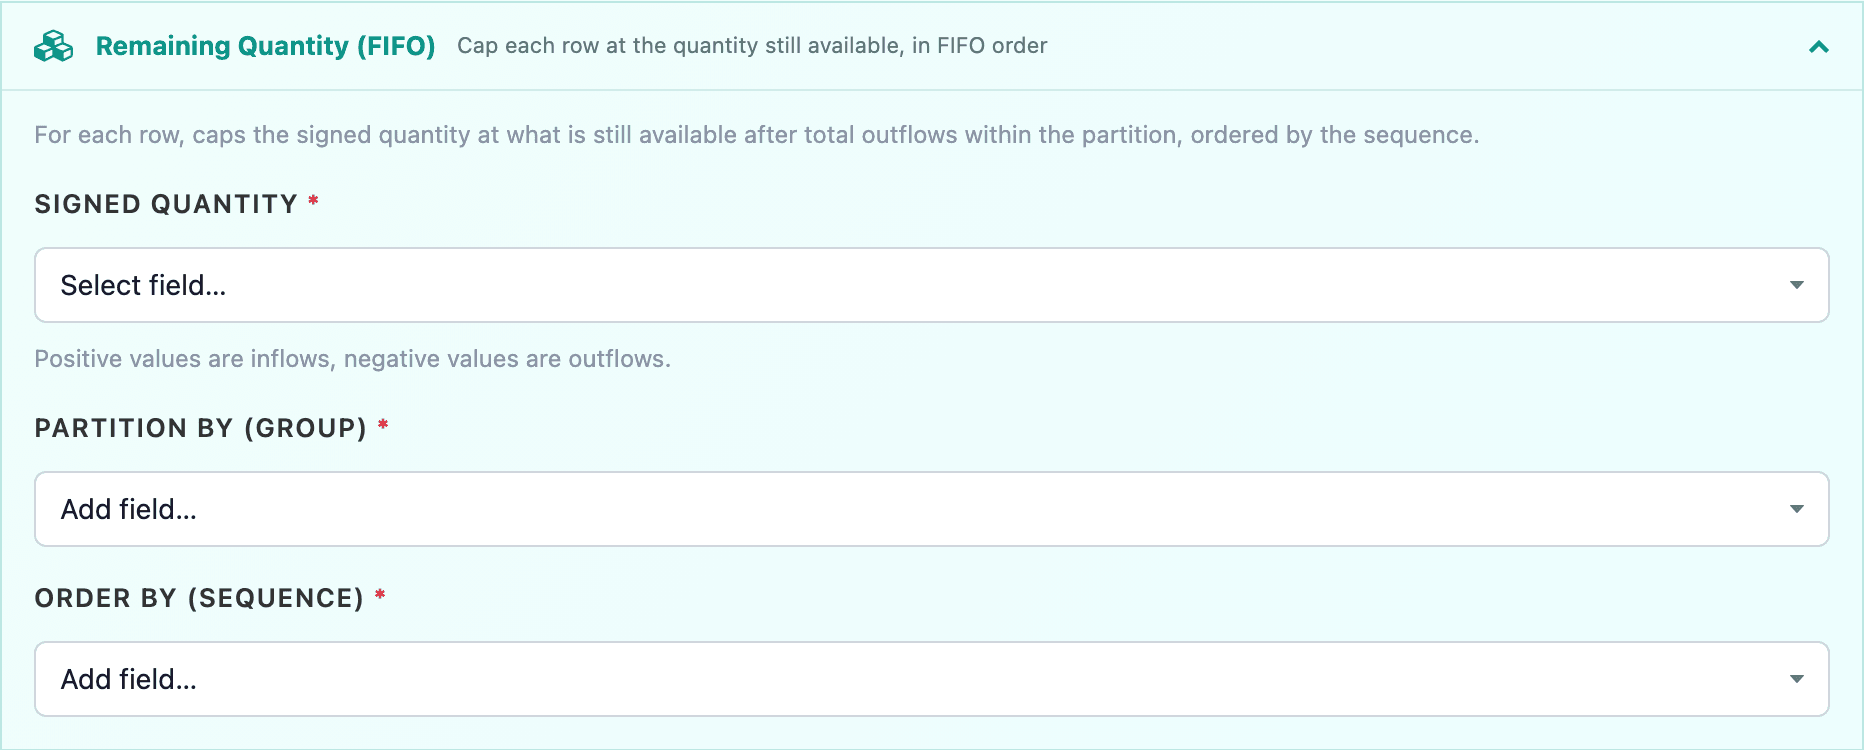
- Signed Quantity: positive for inflows, negative for outflows.
- Partition By (Group): what the stock is counted per, such as the product.
- Order By (Sequence): the order in which inflows are used up, such as the date.
All three are required. Your source needs one row per movement with a signed quantity, which usually means a custom SQL dataset.
Percent of Total (Share)
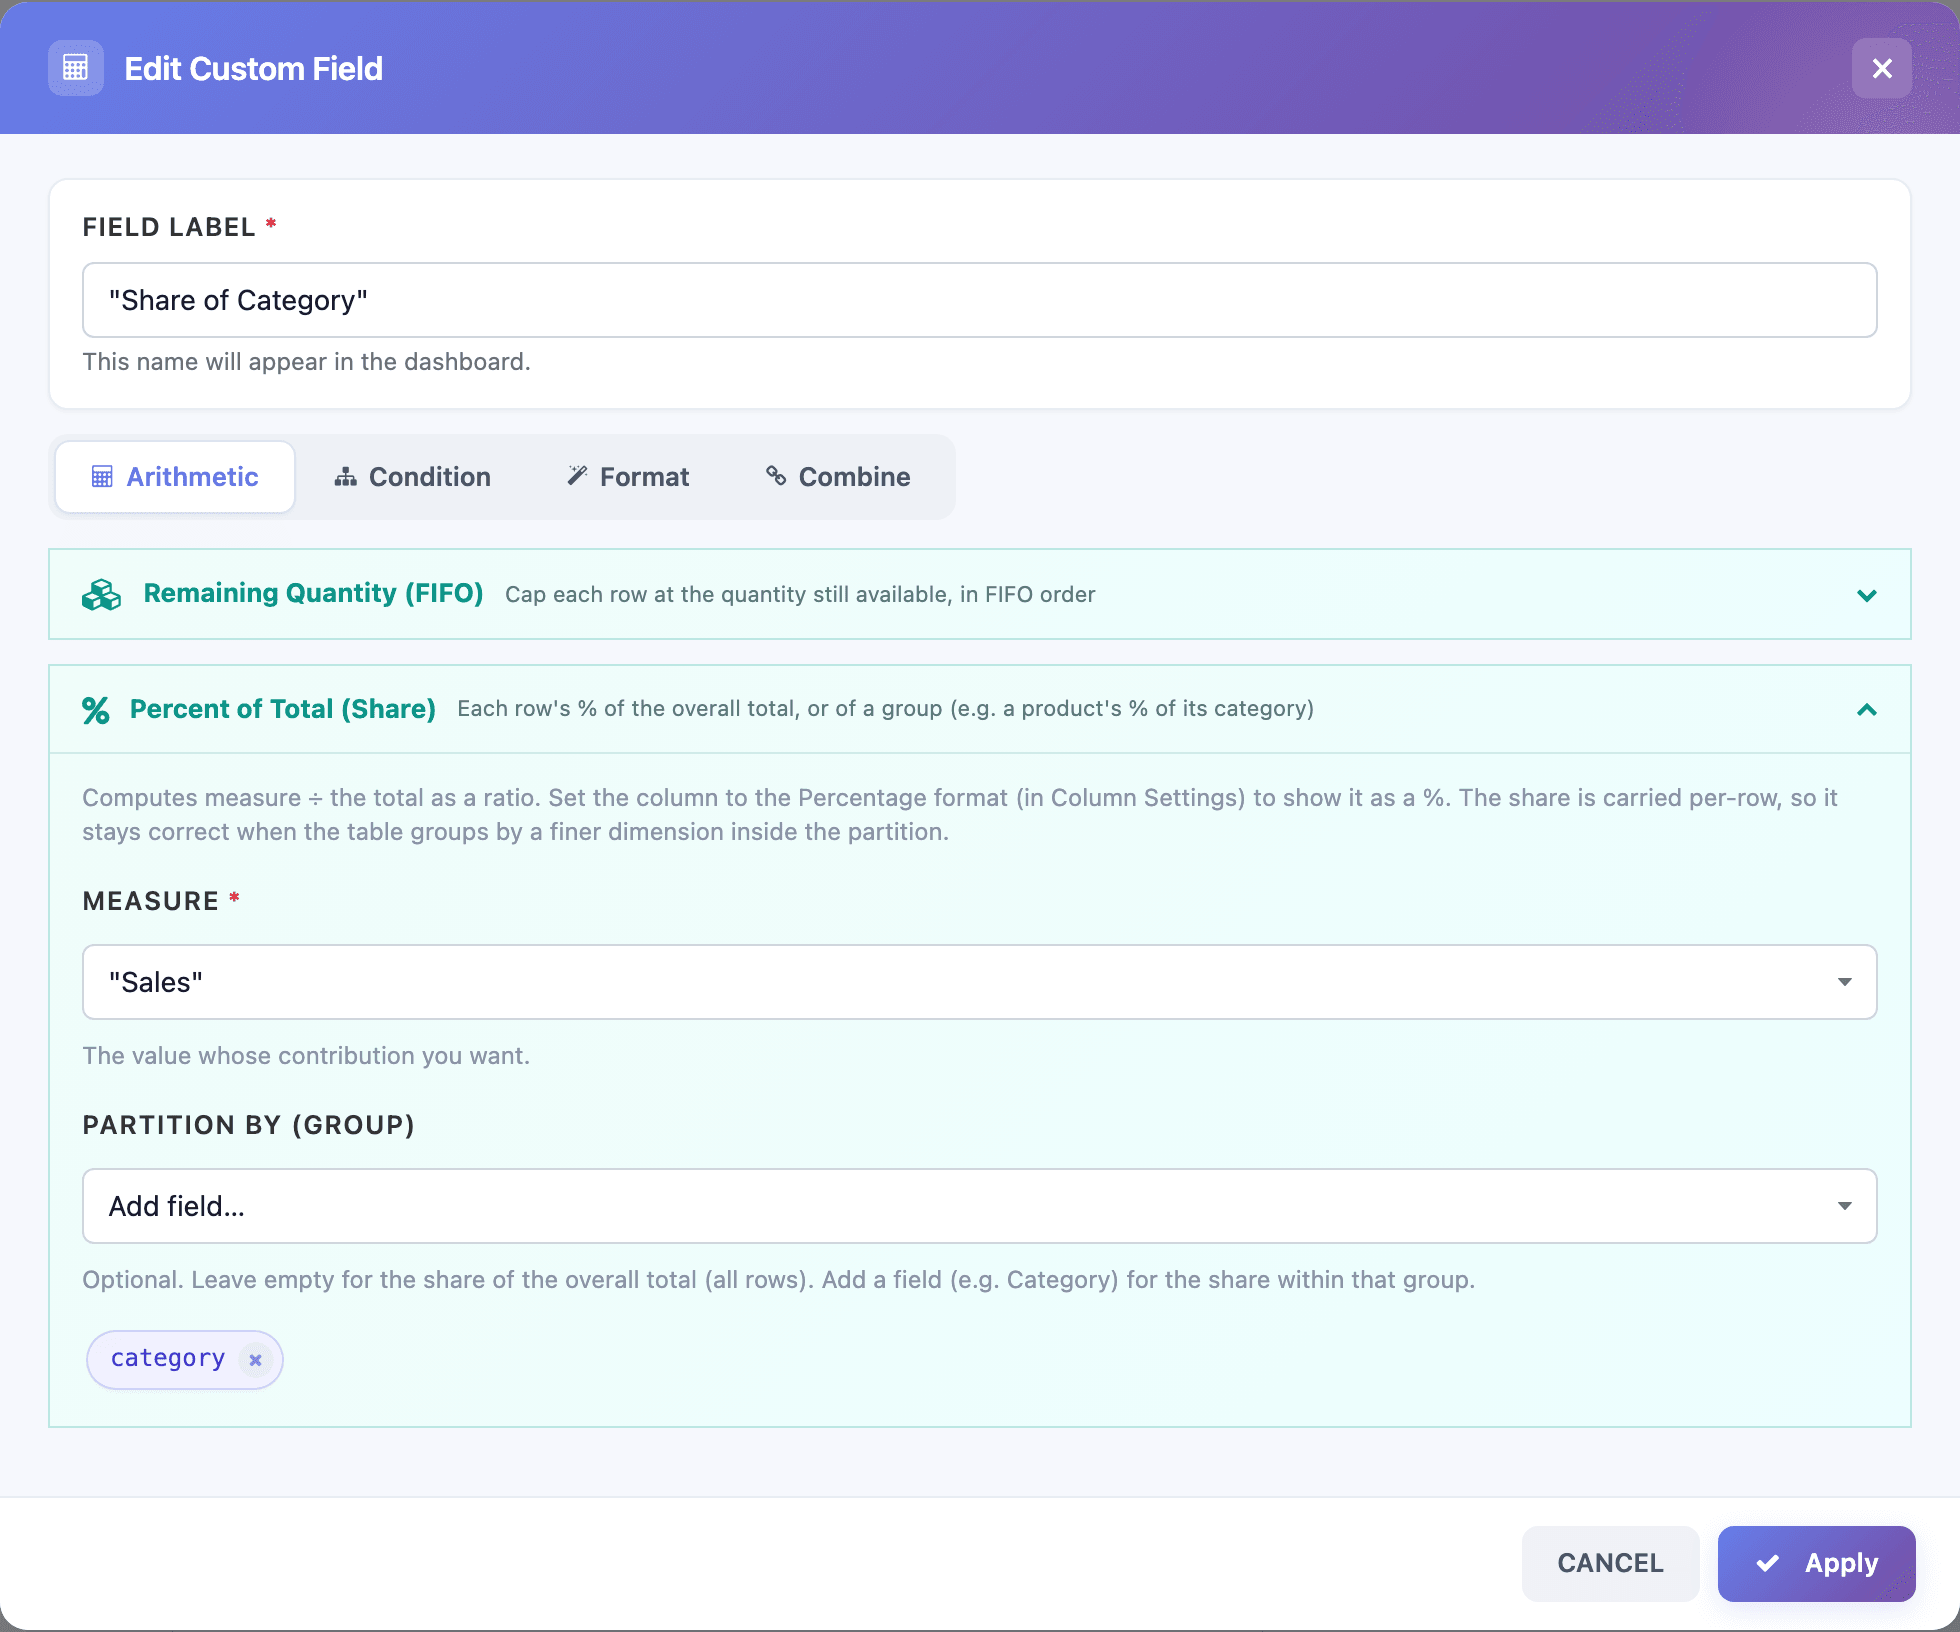
Section titled “Percent of Total (Share)”Tables only. It gives each row’s share of the overall total, or of its group: a product’s share of its category’s sales.
-
Pick the Measure, the value whose share you want.
-
To get the share within a group, add a field under Partition By (Group), such as
category. Leave it empty for the share of all rows. -
Apply, then open the column’s Column Settings and set its format to Percentage. The field produces a ratio (0.2 for 20%).
Which measure to pick depends on the table:
- On a table with Group By (one row per product, say), the measure must be aggregated. First add an Arithmetic custom field such as SUM(sales), then pick it as the measure. A plain column there makes the table fail with a grouping error.
- On a table without Group By (one row per record), pick the plain column. The share is then worked out per record.
The share is of the rows the table reads, after its filters. With a row limit, it’s still the share of everything that passed the filters, not of the rows on screen. See also Totals and % of group.
Condition
Section titled “Condition”Use it to put rows into bands or rename values: “Top seller / Steady / Slow”, “Overdue / Due”, a readable label for a technical status.
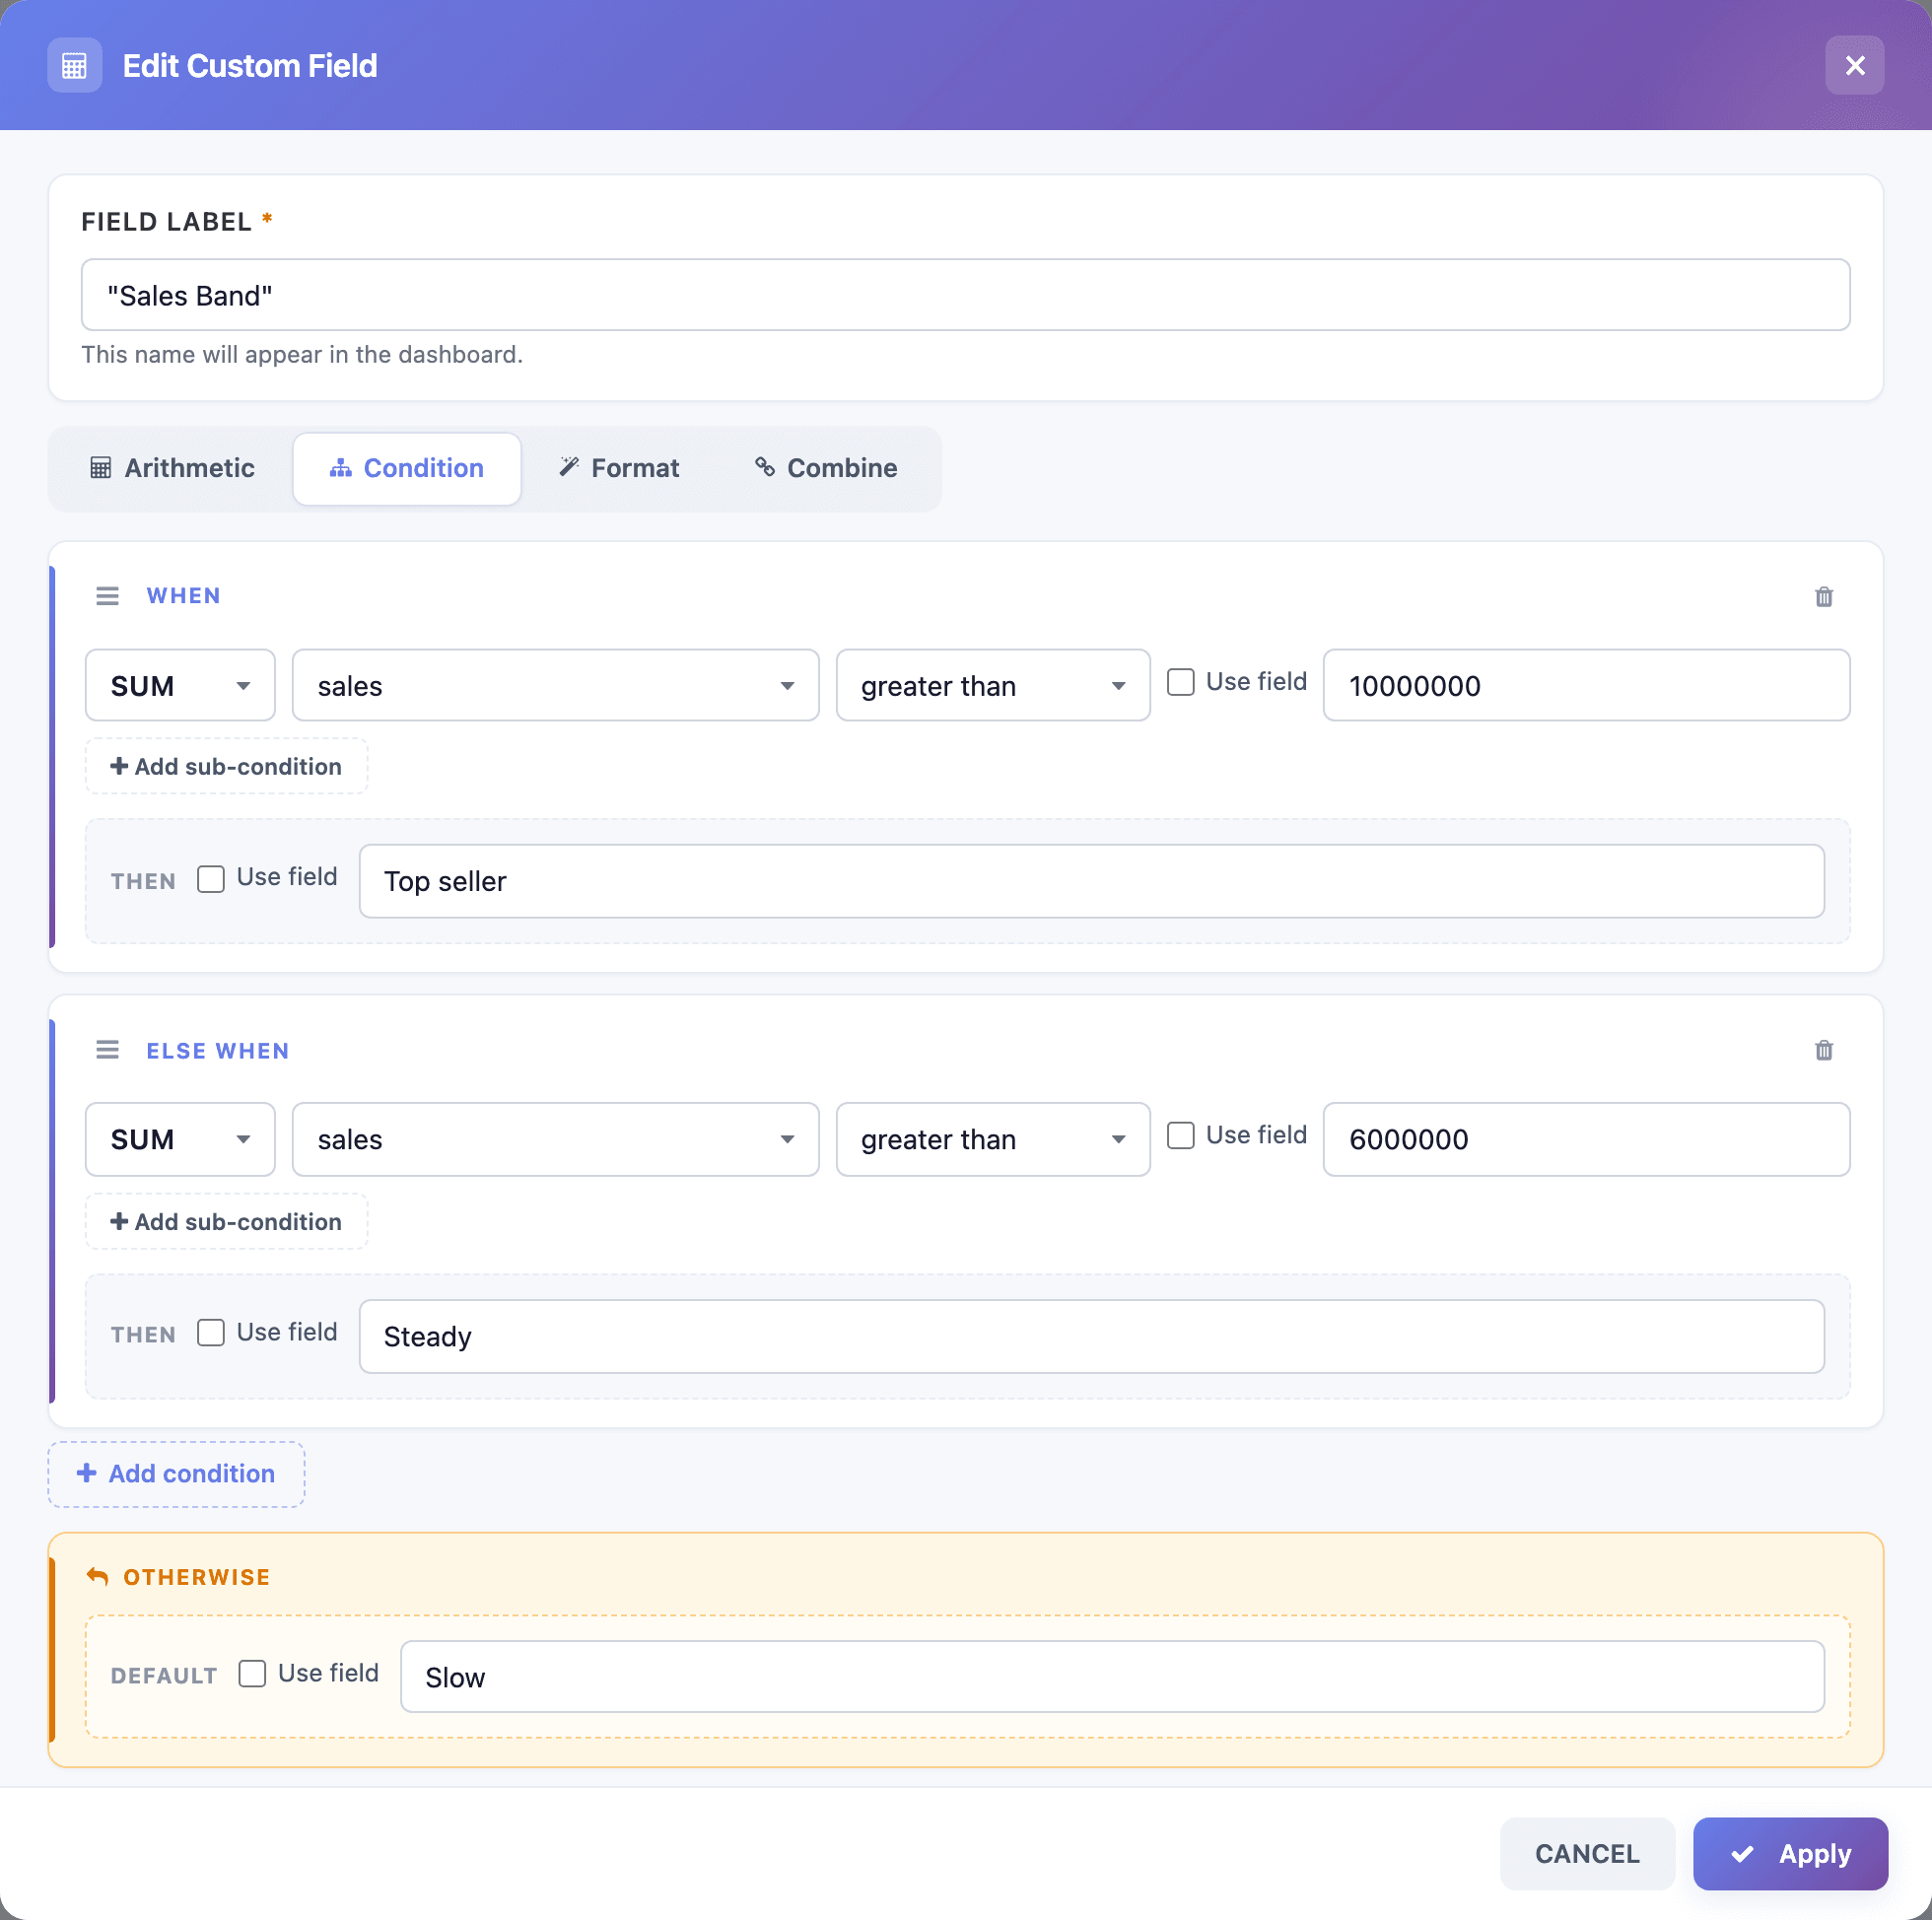
- Each When / Else When branch has one or more conditions: an optional aggregation, a field, a comparison and a value. Add sub-condition adds another, and the AND/OR button sets how they combine.
- Comparisons depend on the field: equals, greater than, before, contains, starts with, is empty and so on.
- Tick Use field to compare with another field instead of a fixed value.
- Then is the result: a fixed value, or another field with Use field.
- Add condition adds a branch. Branches are checked from top to bottom; drag the handle to reorder them.
- Otherwise sets the result when no branch matches. It’s required.
On a chart’s dimension, Condition is the only mode, so you can group a chart by bands.
Format
Section titled “Format”Use it to change how one value looks without changing the data: a date as “January 2024”, a number rounded to 2 decimals, a name in capitals.
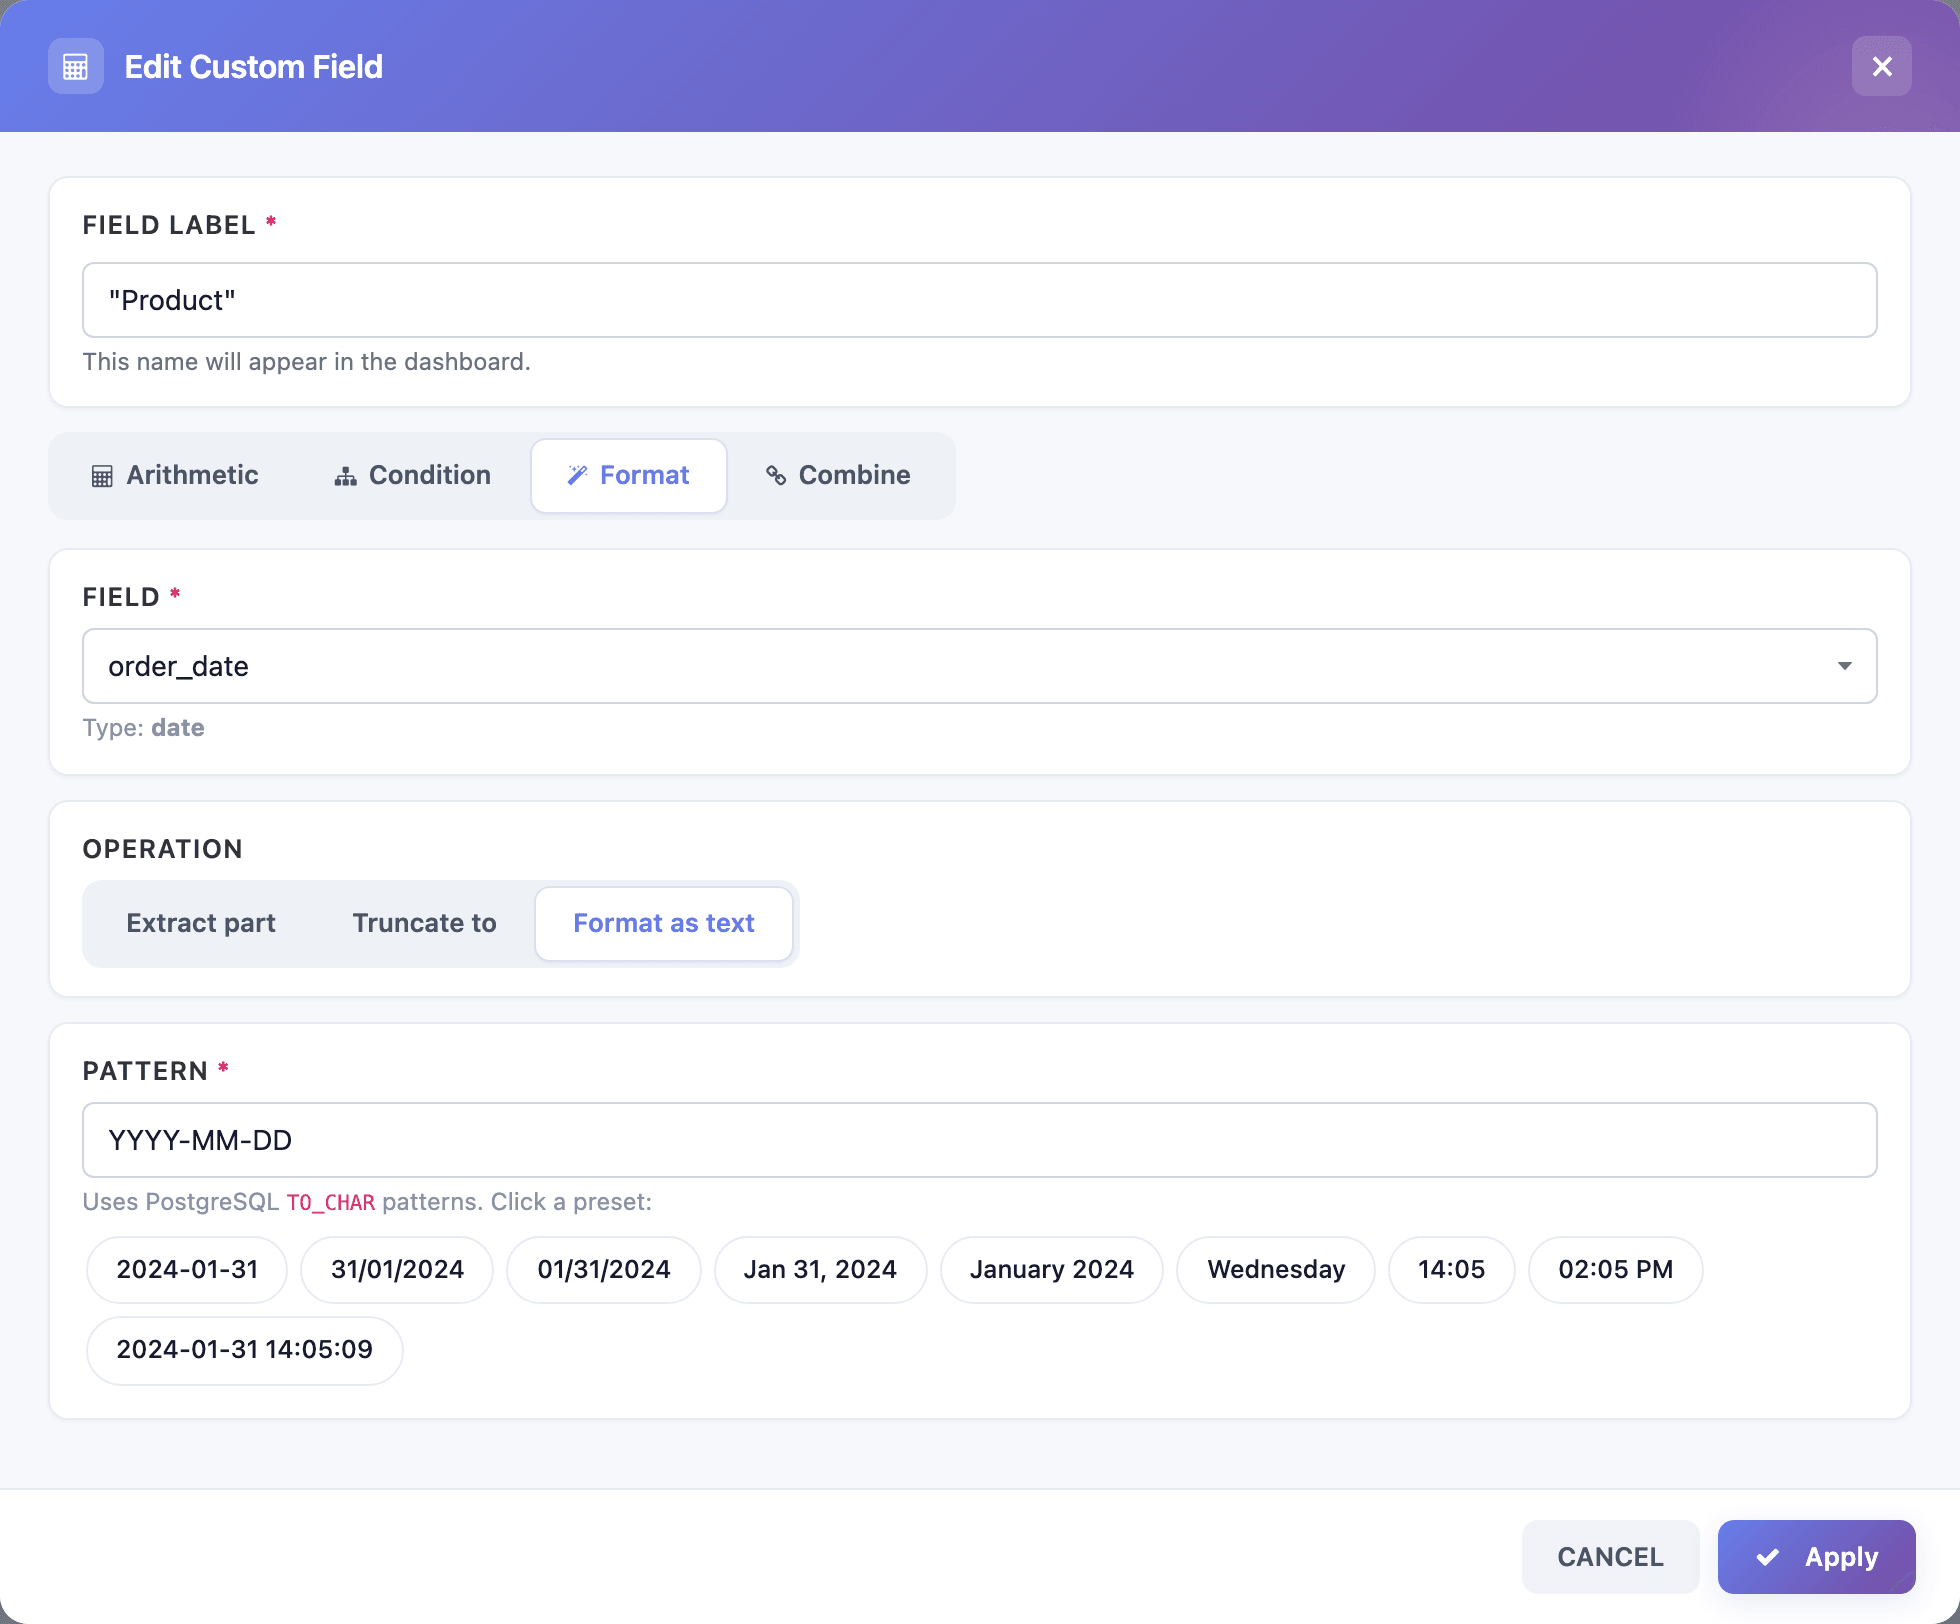
Pick the Field; the wizard shows its type and the operations that fit:
- Date: Extract part (year, quarter, month, week, day…), Truncate to (year start, month start, day…), or Format as text with a Pattern. Click a preset or type a PostgreSQL
TO_CHARpattern. - Number: Round, Round up (ceil), Round down (floor), Absolute value, Multiply by 100 (percent), with Decimal places for rounding.
- Text: UPPERCASE, lowercase, Proper Case, Trim whitespace, Character count.
Format works on one value per row. In a grouped table, format a field you group by, or an aggregated custom field.
Combine
Section titled “Combine”Tables only. It joins several fields into one text column, per row: “category - product”, “customer (salesperson)”.
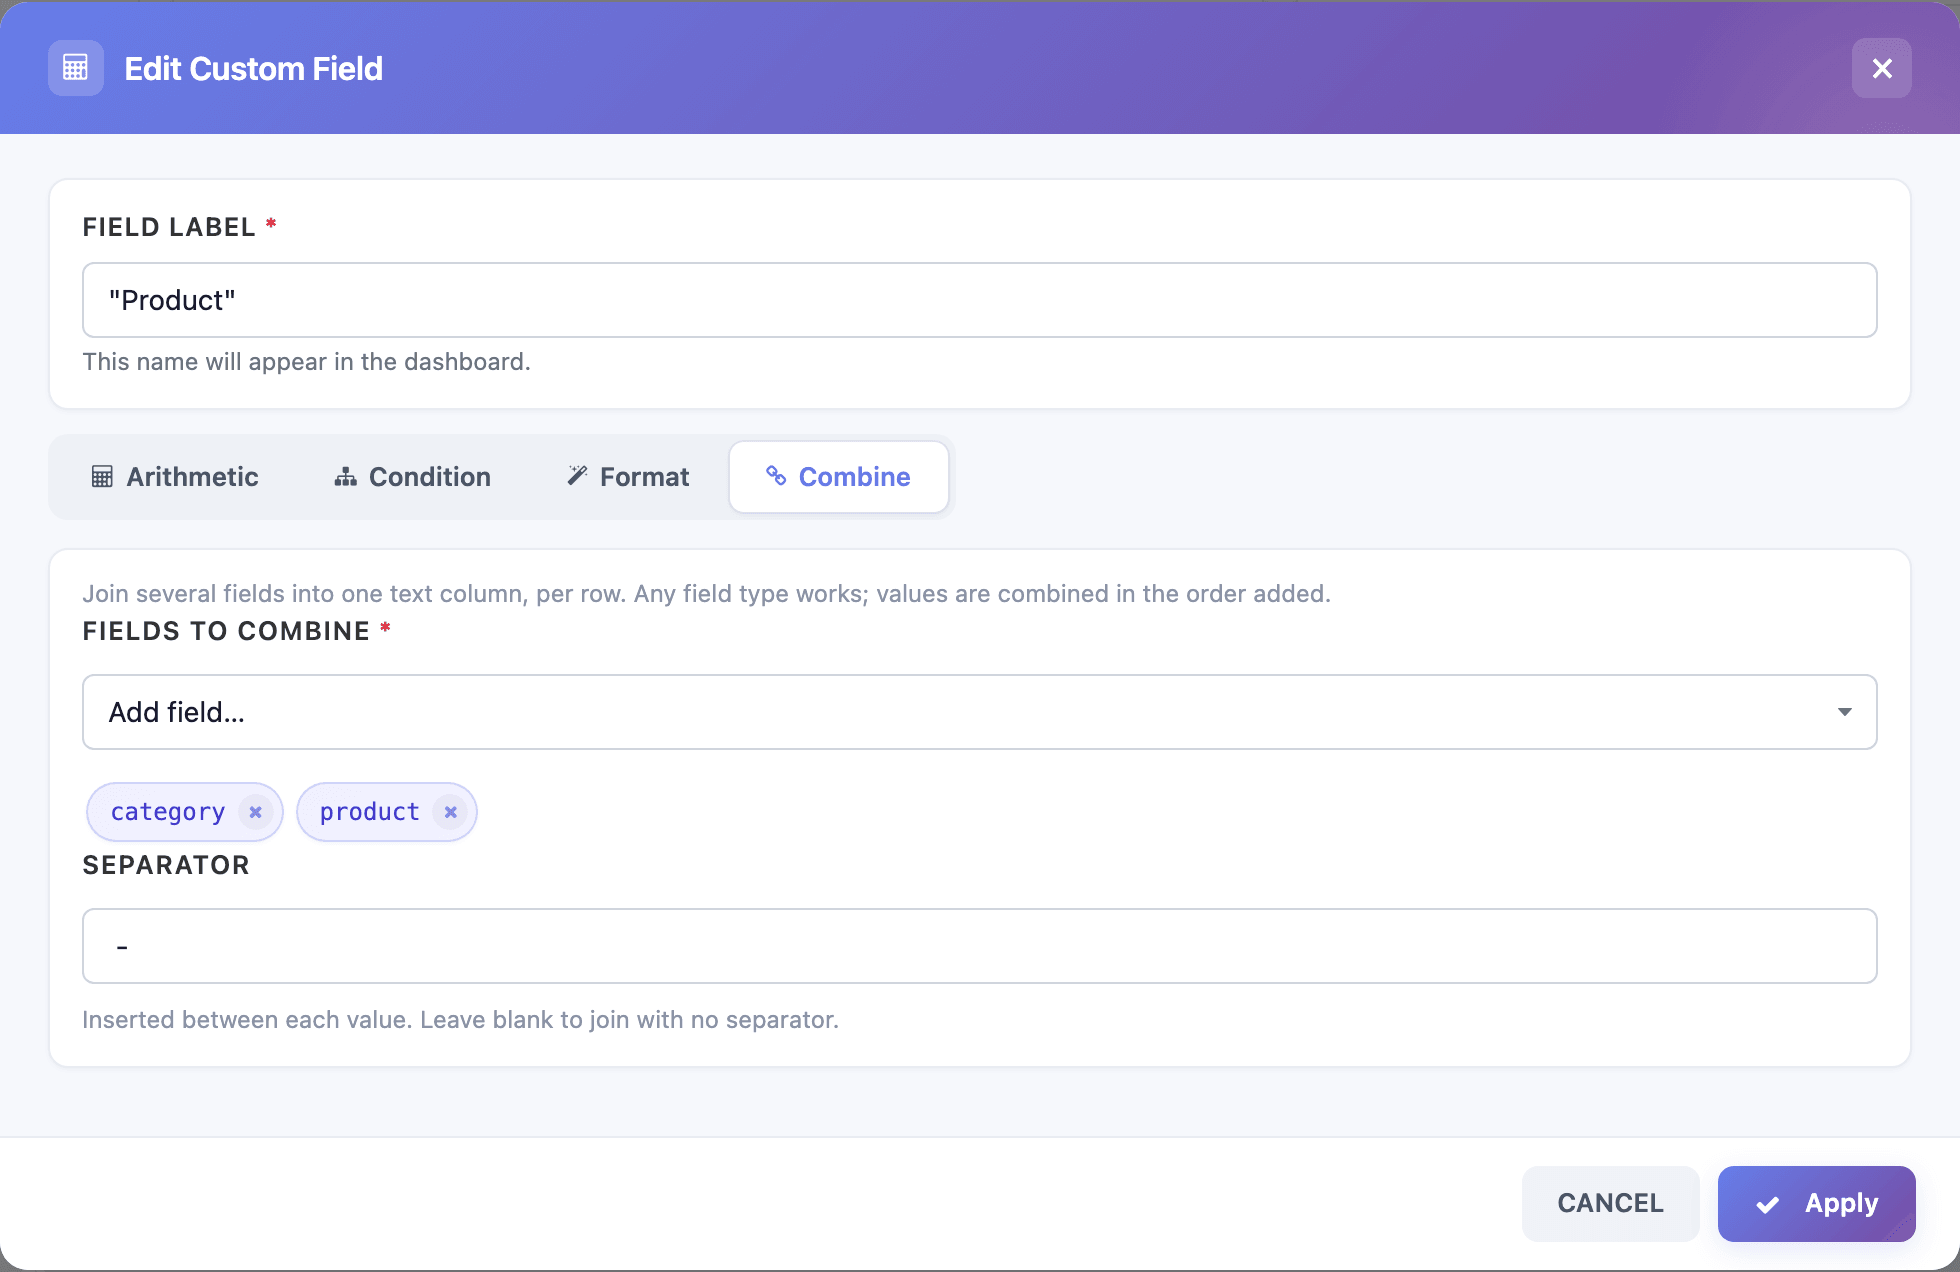
- Add at least two Fields to combine, in the order they should appear. Any field type works.
- Separator goes between values. Leave it blank to join them with nothing in between. Empty values are skipped, so you never get two separators in a row.
In a table with Group By, group by every field you combine.
Good to know
Section titled “Good to know”- A custom field is an SQL expression stored on the widget. If you rename a dataset column it uses, edit the custom field too.
- Custom fields don’t make the dataset slower for other widgets; they only run in their own widget.
- To reuse a calculation in many widgets, put it in the dataset, or convert the table to a dataset.