

Map
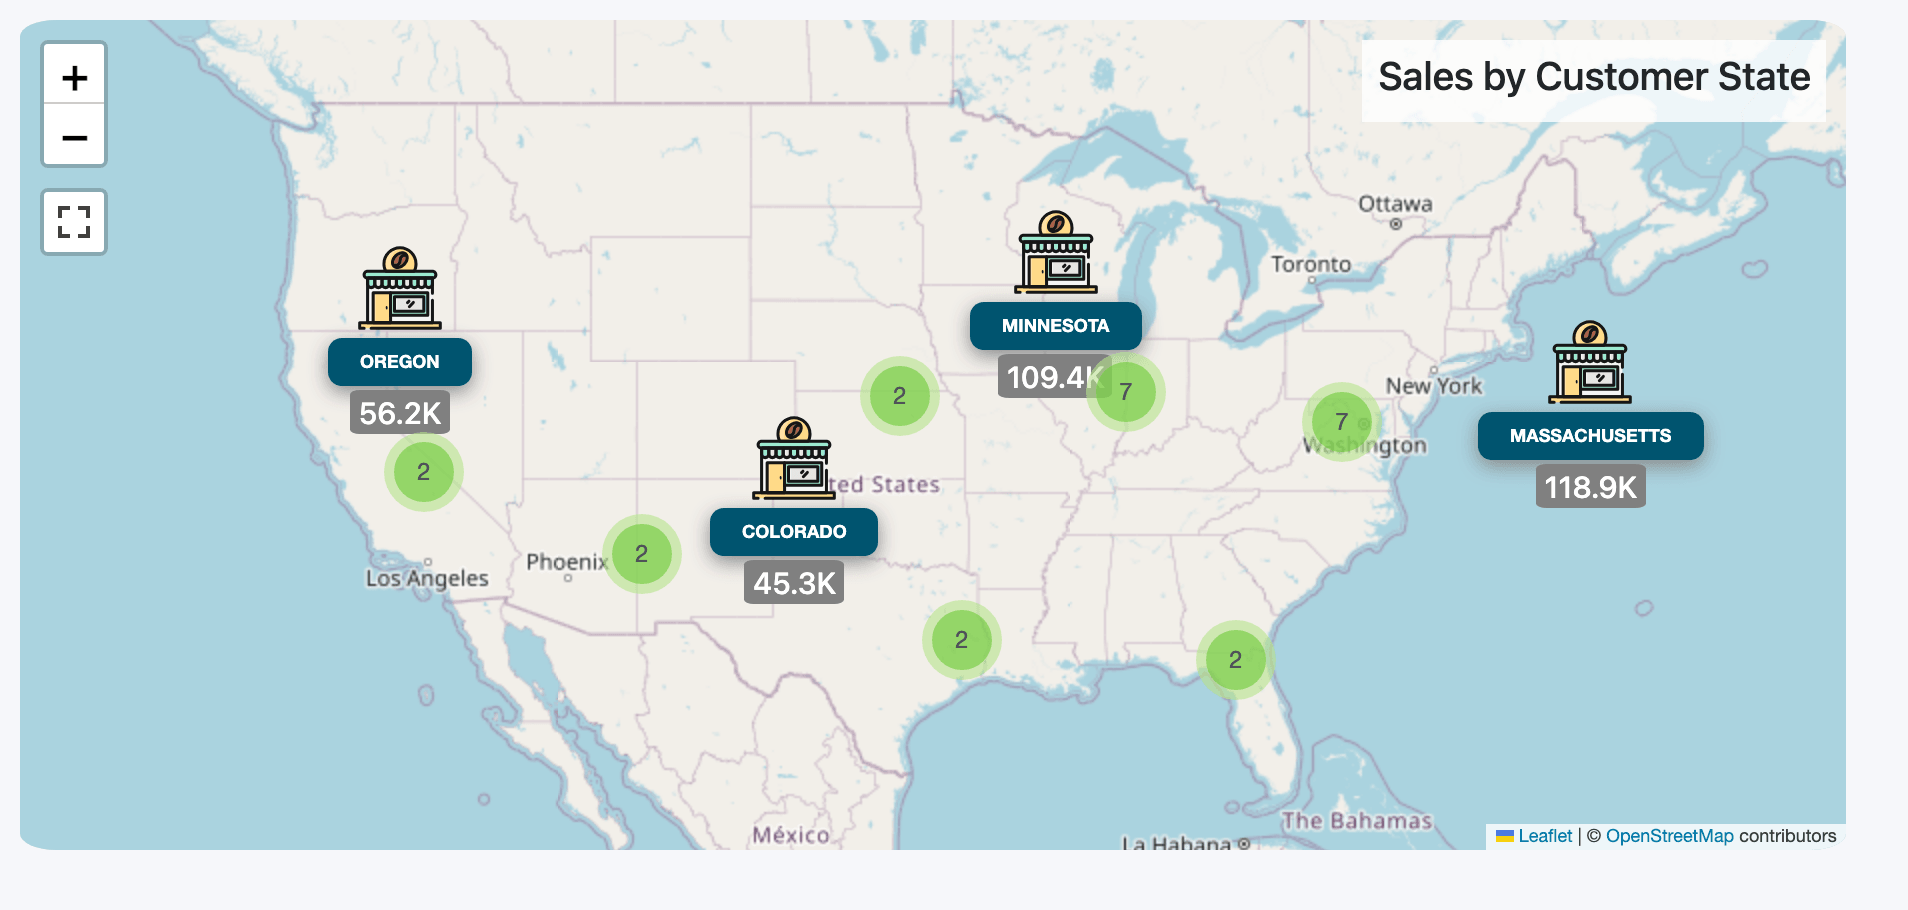
A map places one marker per location, labelled with its name and value: sales per branch, per city or per customer state. Markers that sit close together are gathered into a green circle with a count, and split apart as you zoom in.
What the dataset needs
Section titled “What the dataset needs”Odoo doesn’t store coordinates for countries or states, and the map has no field to choose them. The dataset must have two columns named exactly lat and lng, holding the latitude and longitude of each row. Rows with no latitude are left off the map.
The usual way is a custom SQL dataset that joins your records to a small list of coordinates. The Sales by Customer State dataset behind this map does it like this (shortened):
SELECT so.date_order::date AS order_date, st.name AS customer_state, pt.lat, pt.lng, so.amount_untaxed::float8 AS untaxed_amount FROM sale_order so JOIN res_partner p ON p.id = so.partner_id JOIN res_country_state st ON st.id = p.state_id JOIN (VALUES ('CA', 36.12, -119.68), ('TX', 31.05, -97.56), ('MA', 42.23, -71.53)) AS pt(code, lat, lng) ON pt.code = st.code WHERE so.state IN ('sale', 'done')If your branches or warehouses already have coordinates on their address (Odoo’s Partners Geolocation app fills Geo Latitude and Geo Longitude on contacts), select those columns as lat and lng instead.
Set one up
Section titled “Set one up”-
Click New Item, choose Map and the dataset with
latandlng. -
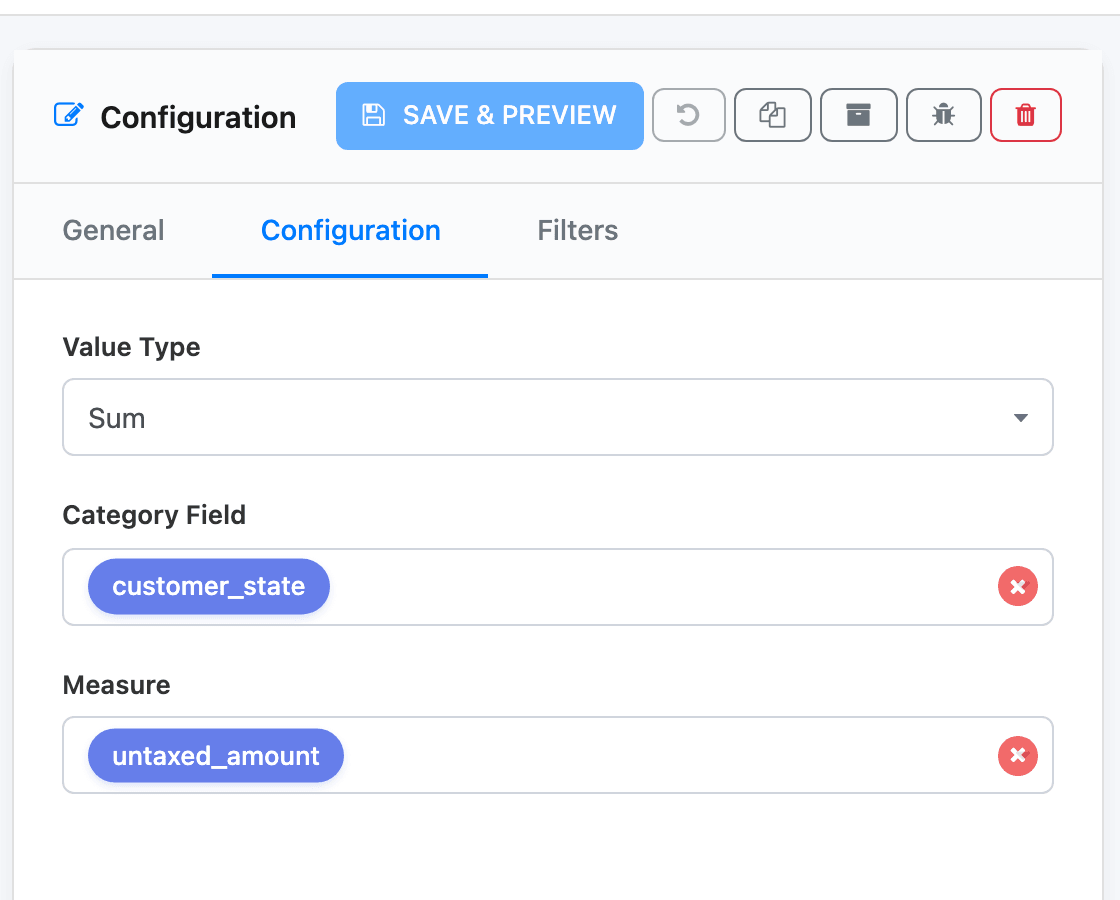
On the Configuration tab, choose the Value Type.
-
Pick the Category Field: the name shown on each marker, such as the state or branch.
-
Pick the Measure, unless the Value Type is Count.
-
Click Save & Preview.
Values on the markers are shortened to K, M and B. Locations with the same name, latitude and longitude are added together into one marker.
Moving around
Section titled “Moving around”Use the + and − buttons or the mouse wheel to zoom, drag to move, and the square button to show the map full screen.
What maps don’t do
Section titled “What maps don’t do”- Filters: a map uses only its own fixed filters from the Filters tab. Viewers get no filter chips on a map, and the dashboard’s global filters and date filter don’t change it. Put the period in a fixed filter, such as Last 365 days, and say so in the title or tooltip.
- Drilldown: clicking a marker doesn’t open records.
- Info tooltip: maps have no ⓘ icon.
The map tiles come from OpenStreetMap, so the people viewing the dashboard need internet access for the map to draw.