

Tiles
A tile shows one number: total sales, open quotations, units sold today. Put the most important tiles in the top row of a dashboard, so the first thing people see is the answer to their main question.
A tile can be plain, or carry a goal with a progress bar, a time bar, a status badge, an owner and a column of quick statistics.
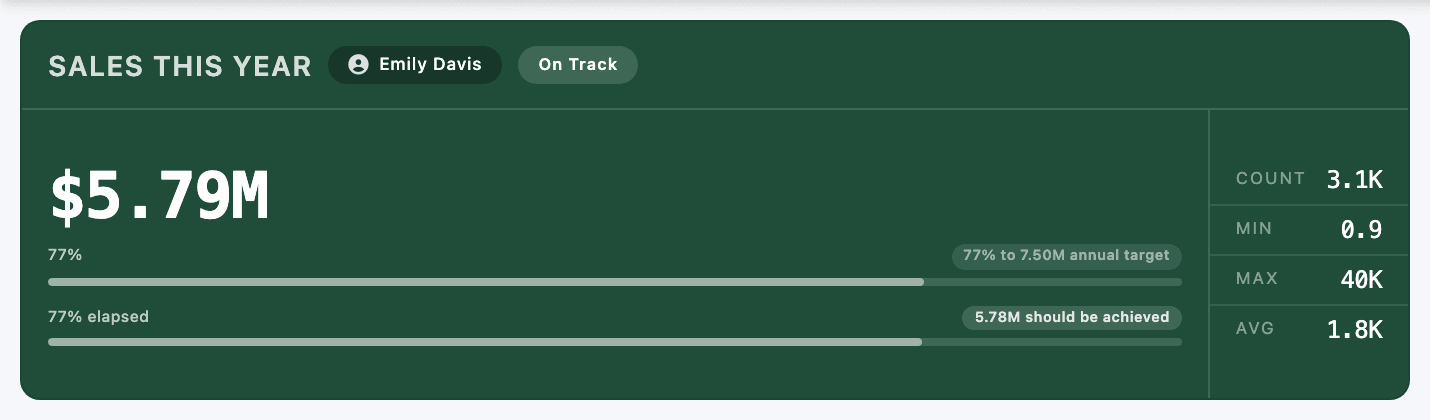
- Responsible User
- Status from KPI Status Ranges
- The value, with Currency Symbol and Format Large Numbers
- Goal bar (KPI Value and KPI Goal Description)
- Time bar (KPI From Date and KPI To Date)
- Show Metrics
Create a tile
Section titled “Create a tile”-
In the Dashboard Builder, click New Item. New items start as a Tile.
-
On the General tab, give it a Name and pick the dataset under Data Source.
-
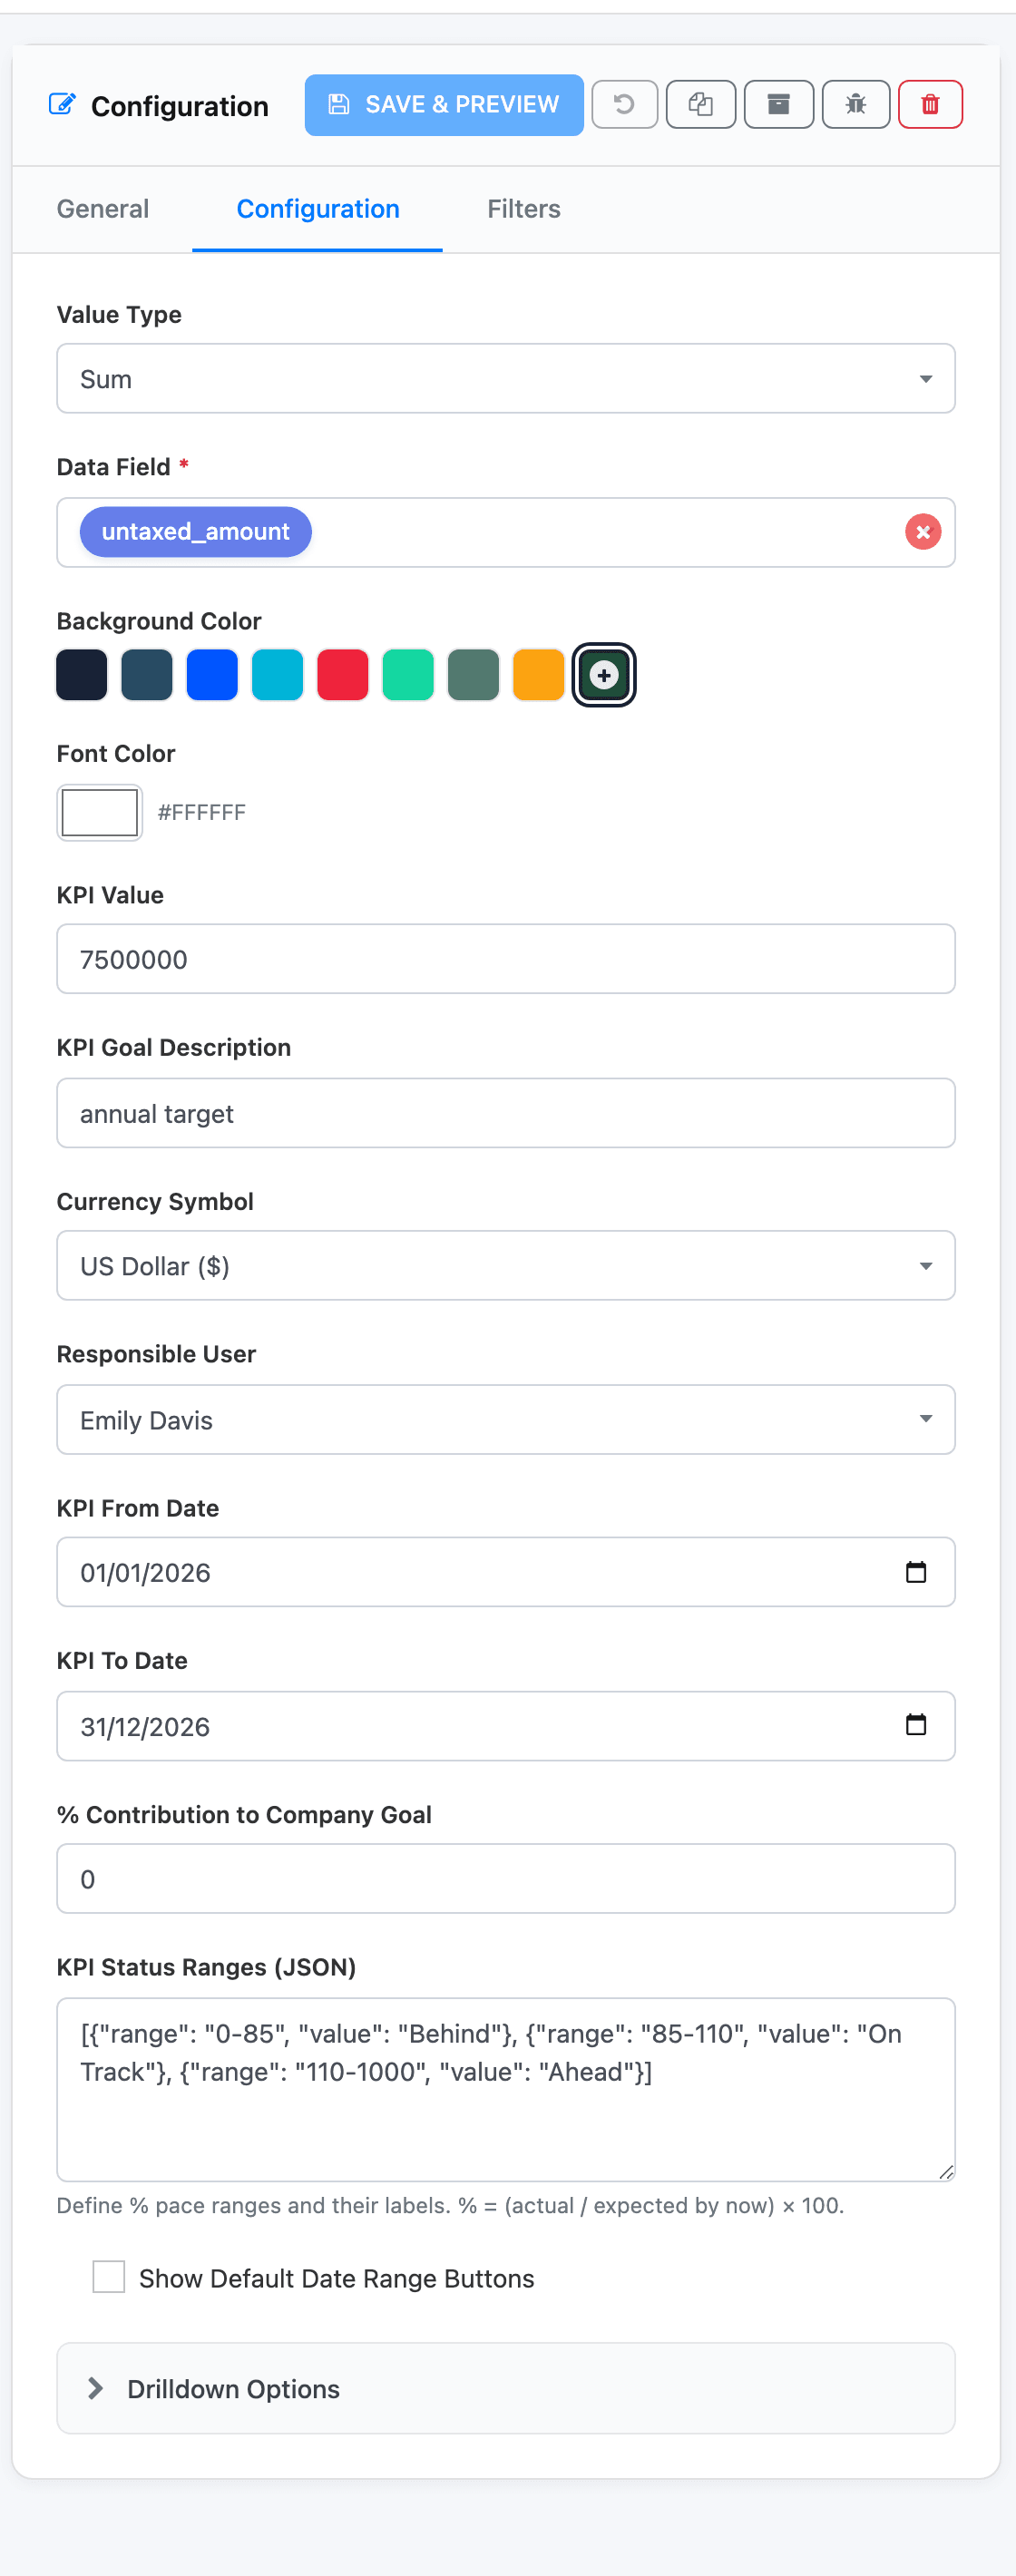
On the Configuration tab, choose the Value Type (Sum, Average, Minimum Value, Maximum Value or Count).
-
Pick the Data Field to summarise. It lists numeric fields only, and disappears when the Value Type is Count.
-
Click Save & Preview.
The Data Field also takes a raw expression starting with $, used as written. That’s how you make ratios: $ROUND(SUM(untaxed_amount) / NULLIF(SUM(quantity), 0)) gives an average selling price. See Fields, expressions and Custom….
Colours
Section titled “Colours”Background Color offers eight preset swatches (Dark Blue, Police Blue, Royal Blue, Ocean Blue, Red, Mint Green, Earthy Green and Gold) and a + swatch, Custom color, which opens a colour picker for any colour. A custom colour wins over the preset. Font Color sets the colour of the title, the value and the bars.
Colour changes show in the preview straight away, before you save.
Number format and currency
Section titled “Number format and currency”Three settings decide how the value is written:
- Currency Symbol (Configuration tab) puts US Dollar ($), Euro (€), Pound (£) or Saudi Riyal (SAR) before the number. The Riyal uses the new Riyal sign.
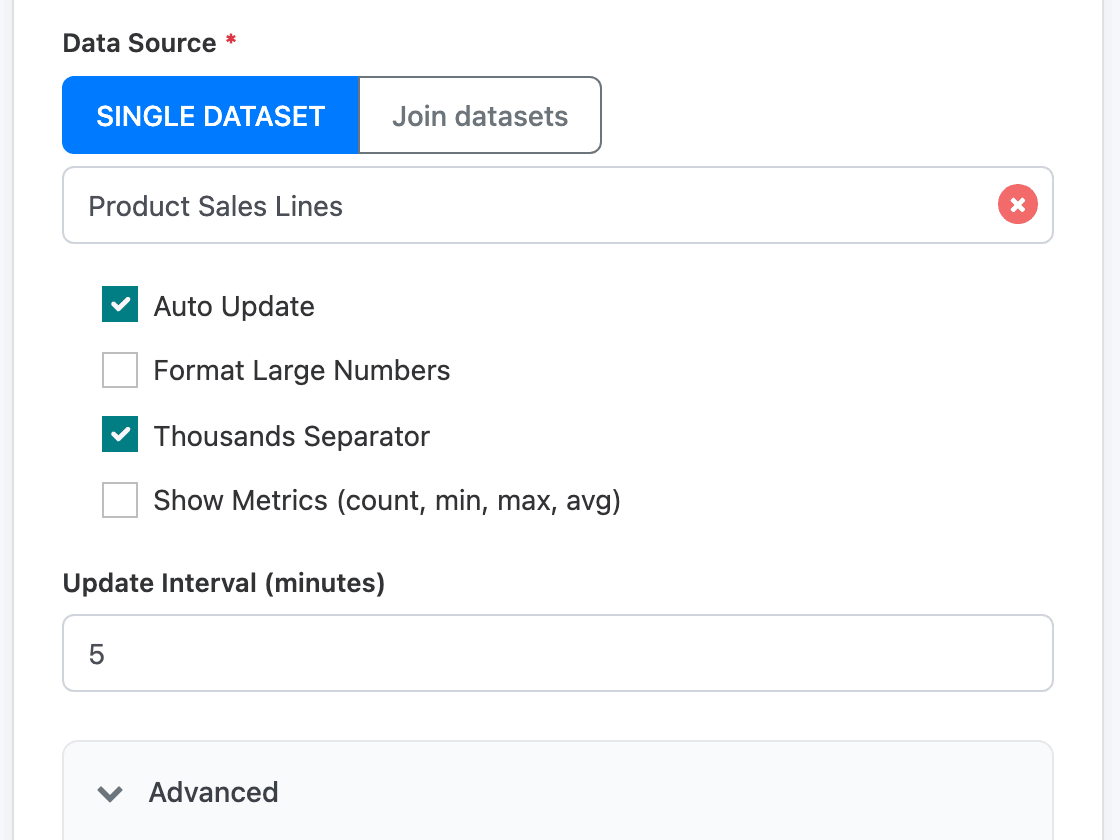
- Format Large Numbers (General tab, on by default) shortens big numbers: 5,788,387 becomes 5.79M, 24,688 becomes 24.7K.
- Thousands Separator (General tab) writes the full number with commas: 24,688.
Format Large Numbers and Thousands Separator exclude each other: ticking one clears the other. With neither, the number is shown as it comes, without separators.

Values are whole numbers: Sum, Average, Minimum Value and Maximum Value are rounded before they reach the tile.
Goal and progress bar
Section titled “Goal and progress bar”Give a tile a goal and it shows how far along you are.
- KPI Value: the goal, as a whole number. 0 or empty means no goal bar.
- KPI Goal Description: the word after the goal in the bar’s label. With annual target, the label reads “77% to 7.50M annual target”. New tiles start with goal.
Once the value passes the goal, the label changes to how much you are over, such as “120K over target”.
Time bar and status
Section titled “Time bar and status”Add a period to the goal and the tile also shows how much of the period has passed, and whether you are keeping up.
- KPI From Date and KPI To Date draw a second bar, “77% elapsed”, and a badge with what should be achieved by today (“5.78M should be achieved”). The badge turns green when you are well ahead and red when you are behind.
- KPI Status Ranges (JSON) adds a status badge next to the title. The tile works out its pace: the value as a percentage of what it should be by today. The first range that contains the pace gives the label.
[{"range": "0-85", "value": "Behind"}, {"range": "85-110", "value": "On Track"}, {"range": "110-1000", "value": "Ahead"}]With $5.79M sold, a $7.5M target and 77% of the year gone, the pace is about 100%, so the tile reads On Track. The status needs all four settings: KPI Value, both dates and the ranges.
% Contribution to Company Goal is stored with the tile but isn’t shown anywhere on the dashboard in this version.
Responsible user
Section titled “Responsible user”Responsible User shows a badge with a person’s name in the tile header, so everyone knows who owns the number. It’s for display only; it doesn’t send anything or limit access.
Show Metrics
Section titled “Show Metrics”Show Metrics (count, min, max, avg) (General tab) adds a column on the right with COUNT, MIN, MAX and AVG of the data field, across the rows behind the tile. On Sales This Year, that’s the number of order lines and the smallest, largest and average line.
Metrics need a plain field as the Data Field; a tile with a $ expression doesn’t show them.
Auto Update
Section titled “Auto Update”Auto Update (General tab) refreshes the tile on its own every Update Interval (minutes), which suits a “sales today” tile on a wall screen. It pauses while the browser tab is hidden.
Info tooltip and refreshing one tile
Section titled “Info tooltip and refreshing one tile”Hover a tile to see two icons in its bottom-right corner:
- ⓘ shows the Info Tooltip you wrote on the General tab, under Advanced. Click it for an Update button that reloads this tile only.
- The eye icon blurs the number on your screen (Click to blur / Click to show), handy when sharing your screen.
When the tile has filters that viewers can change, a filter icon appears in its header; see Widget filters. Clicking into the records behind a tile is covered in Drilldown.
Limits
Section titled “Limits”- A tile can’t compare with the previous period by itself. See Previous-period comparison for a way to do it with a table.
- Show Default Date Range Buttons on the tile’s Configuration tab has no effect on tiles. The buttons appear on charts and tables only.