

Build your first dashboard
In this walkthrough you build Sales at a Glance, a small dashboard with a total sales tile, a monthly sales chart and a date filter. It takes about ten minutes.
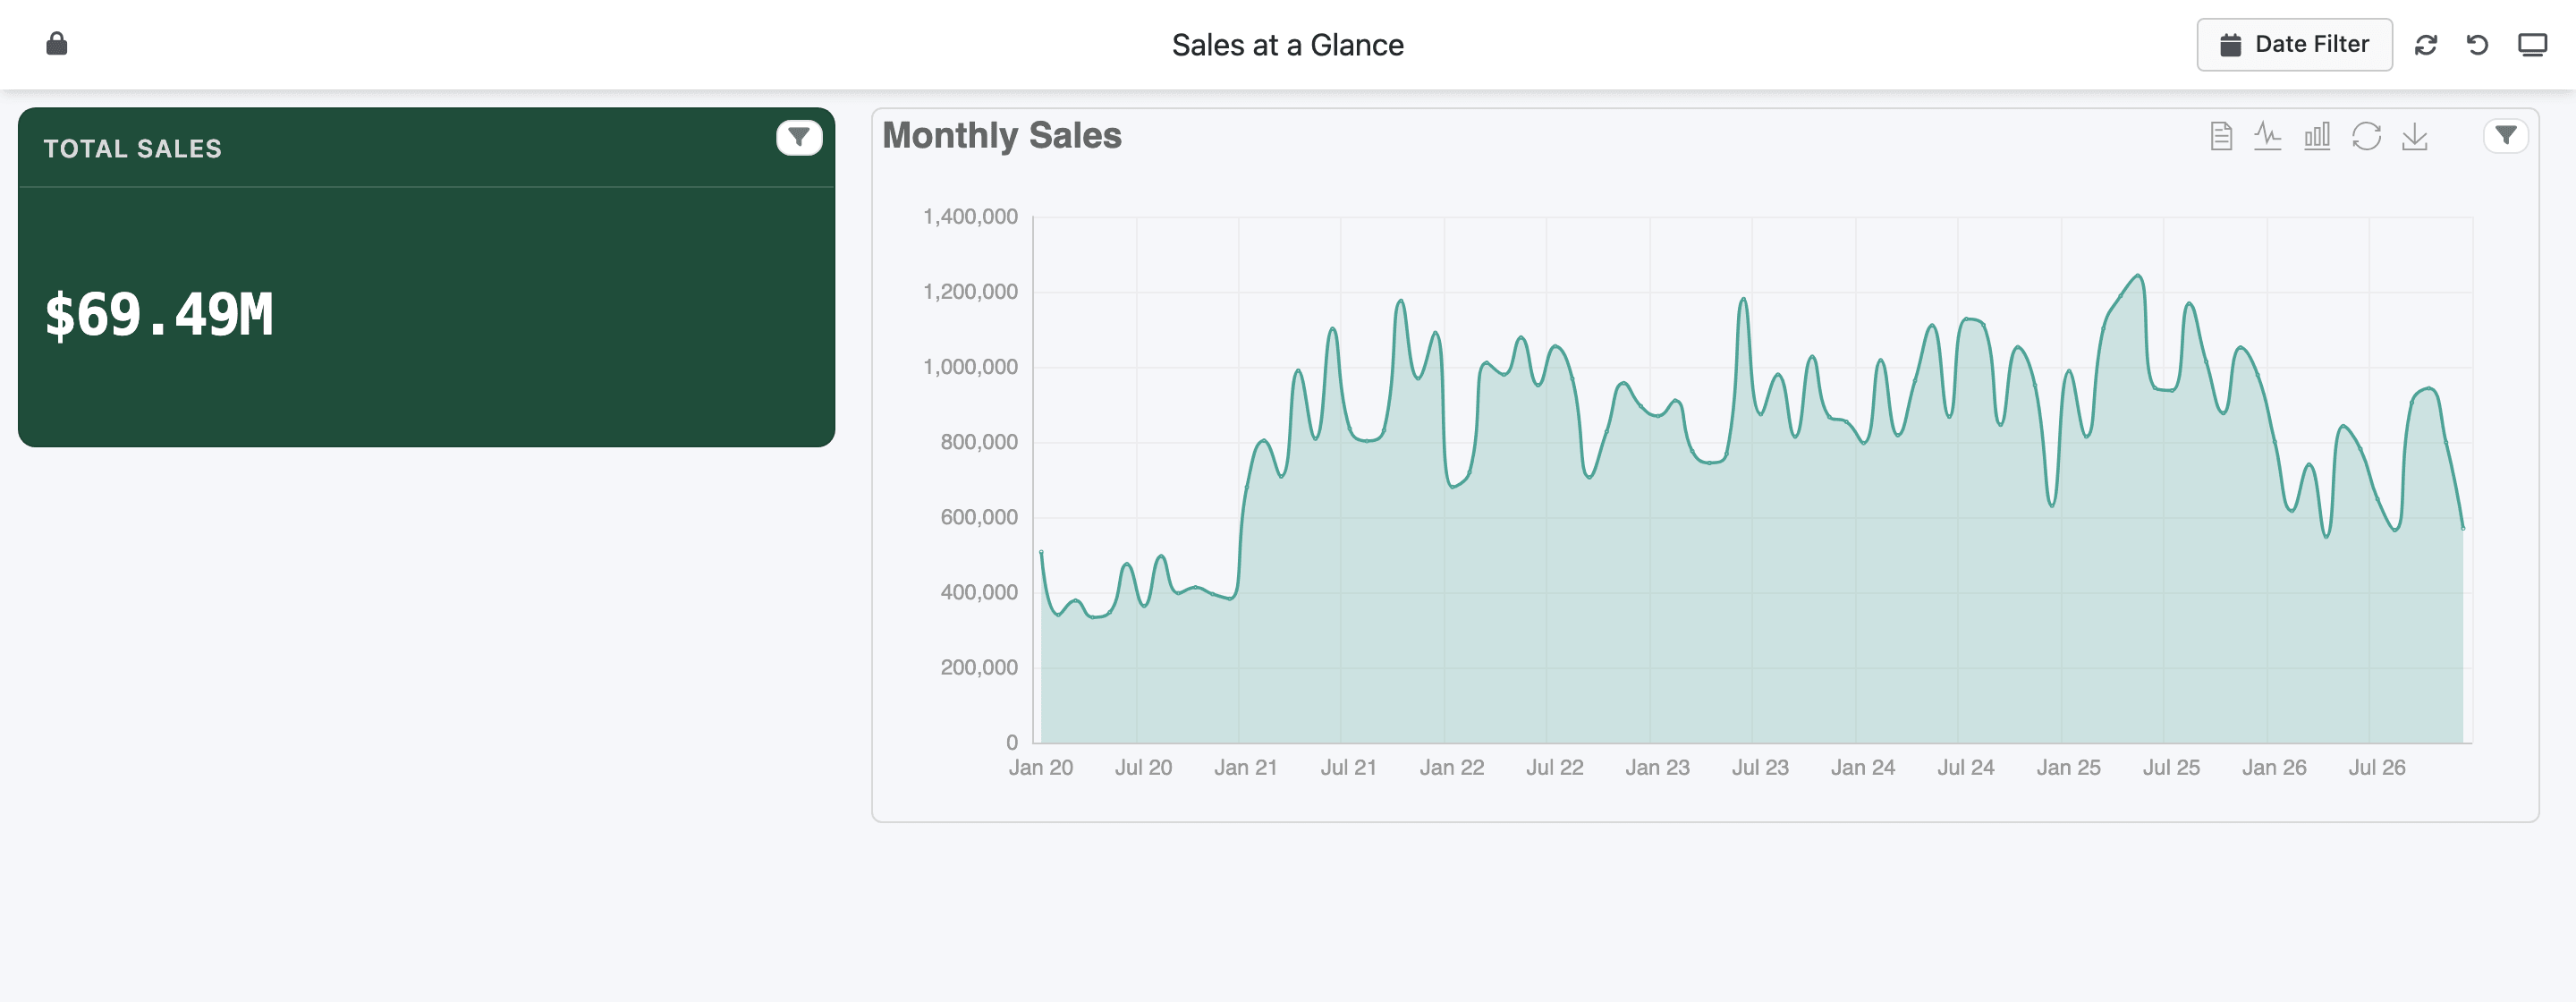
You need the Dashboard Builder (SAAS) access right (see Install the app). The steps use a dataset called Sale Orders, built on Odoo’s Sales Order model with the order date, customer, salesperson, status and total. If you don’t have it yet, ask someone with the Dataset Builder (SAAS) right to create it, or follow the Dataset Builder tour.
1. Create the dashboard
Section titled “1. Create the dashboard”-
Go to Odoo Dashboards → Configurations → Dashboard Builder.
-
Click New Dashboard, type Sales at a Glance as the Dashboard Name, and click Create Dashboard.
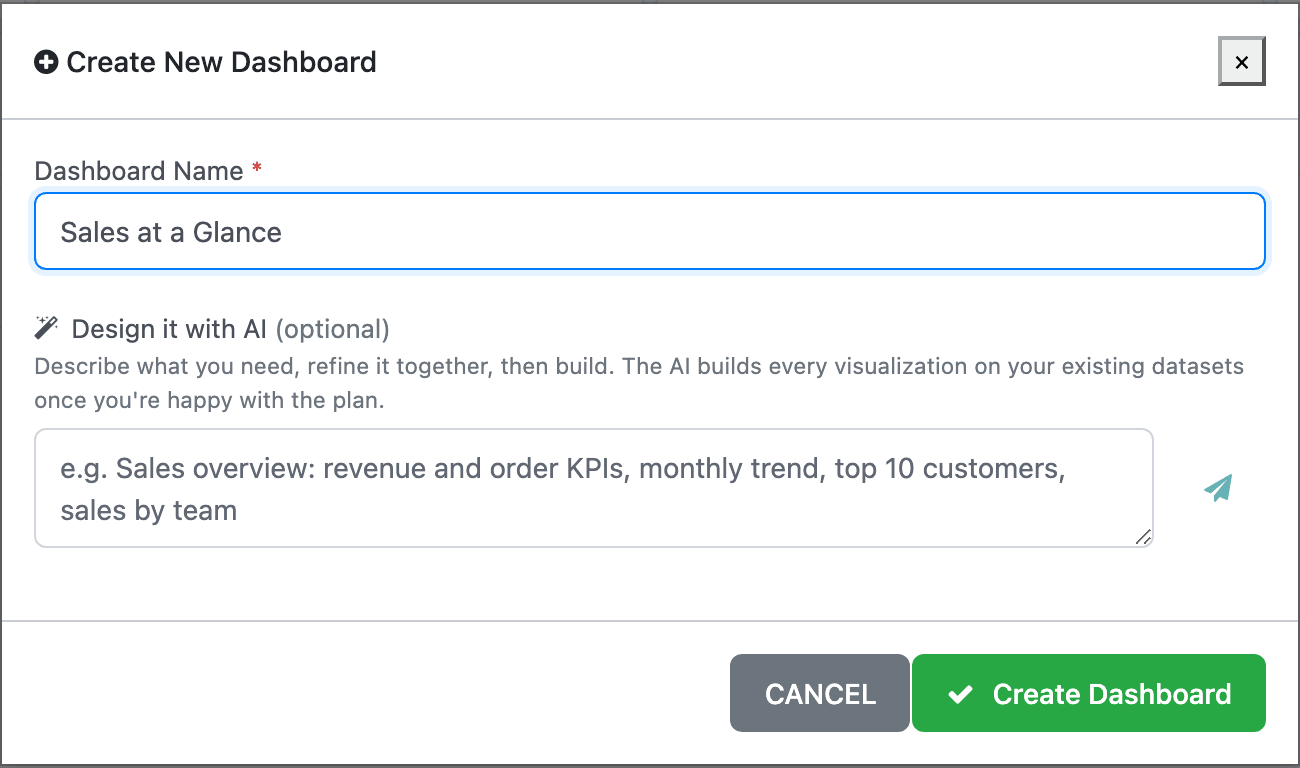
The builder opens the new, empty dashboard. It already has its own entry in the Odoo Dashboards menu, but until you share it (step 6) only the administrator sees that entry. If you aren’t the administrator, add yourself under Add Users when you get to step 6; until then, open the dashboard with View Dashboard in the builder.
2. Add a KPI tile
Section titled “2. Add a KPI tile”A tile shows one number. This one adds up the total of every confirmed sales order.
-
Click Create First Item (or New Item in the top bar). A new item called New Analytics Item appears, already set to Tile.
-
On the General tab, change the Name to Total Sales.
-
Under Data Source, keep Single dataset and pick Sale Orders.
-
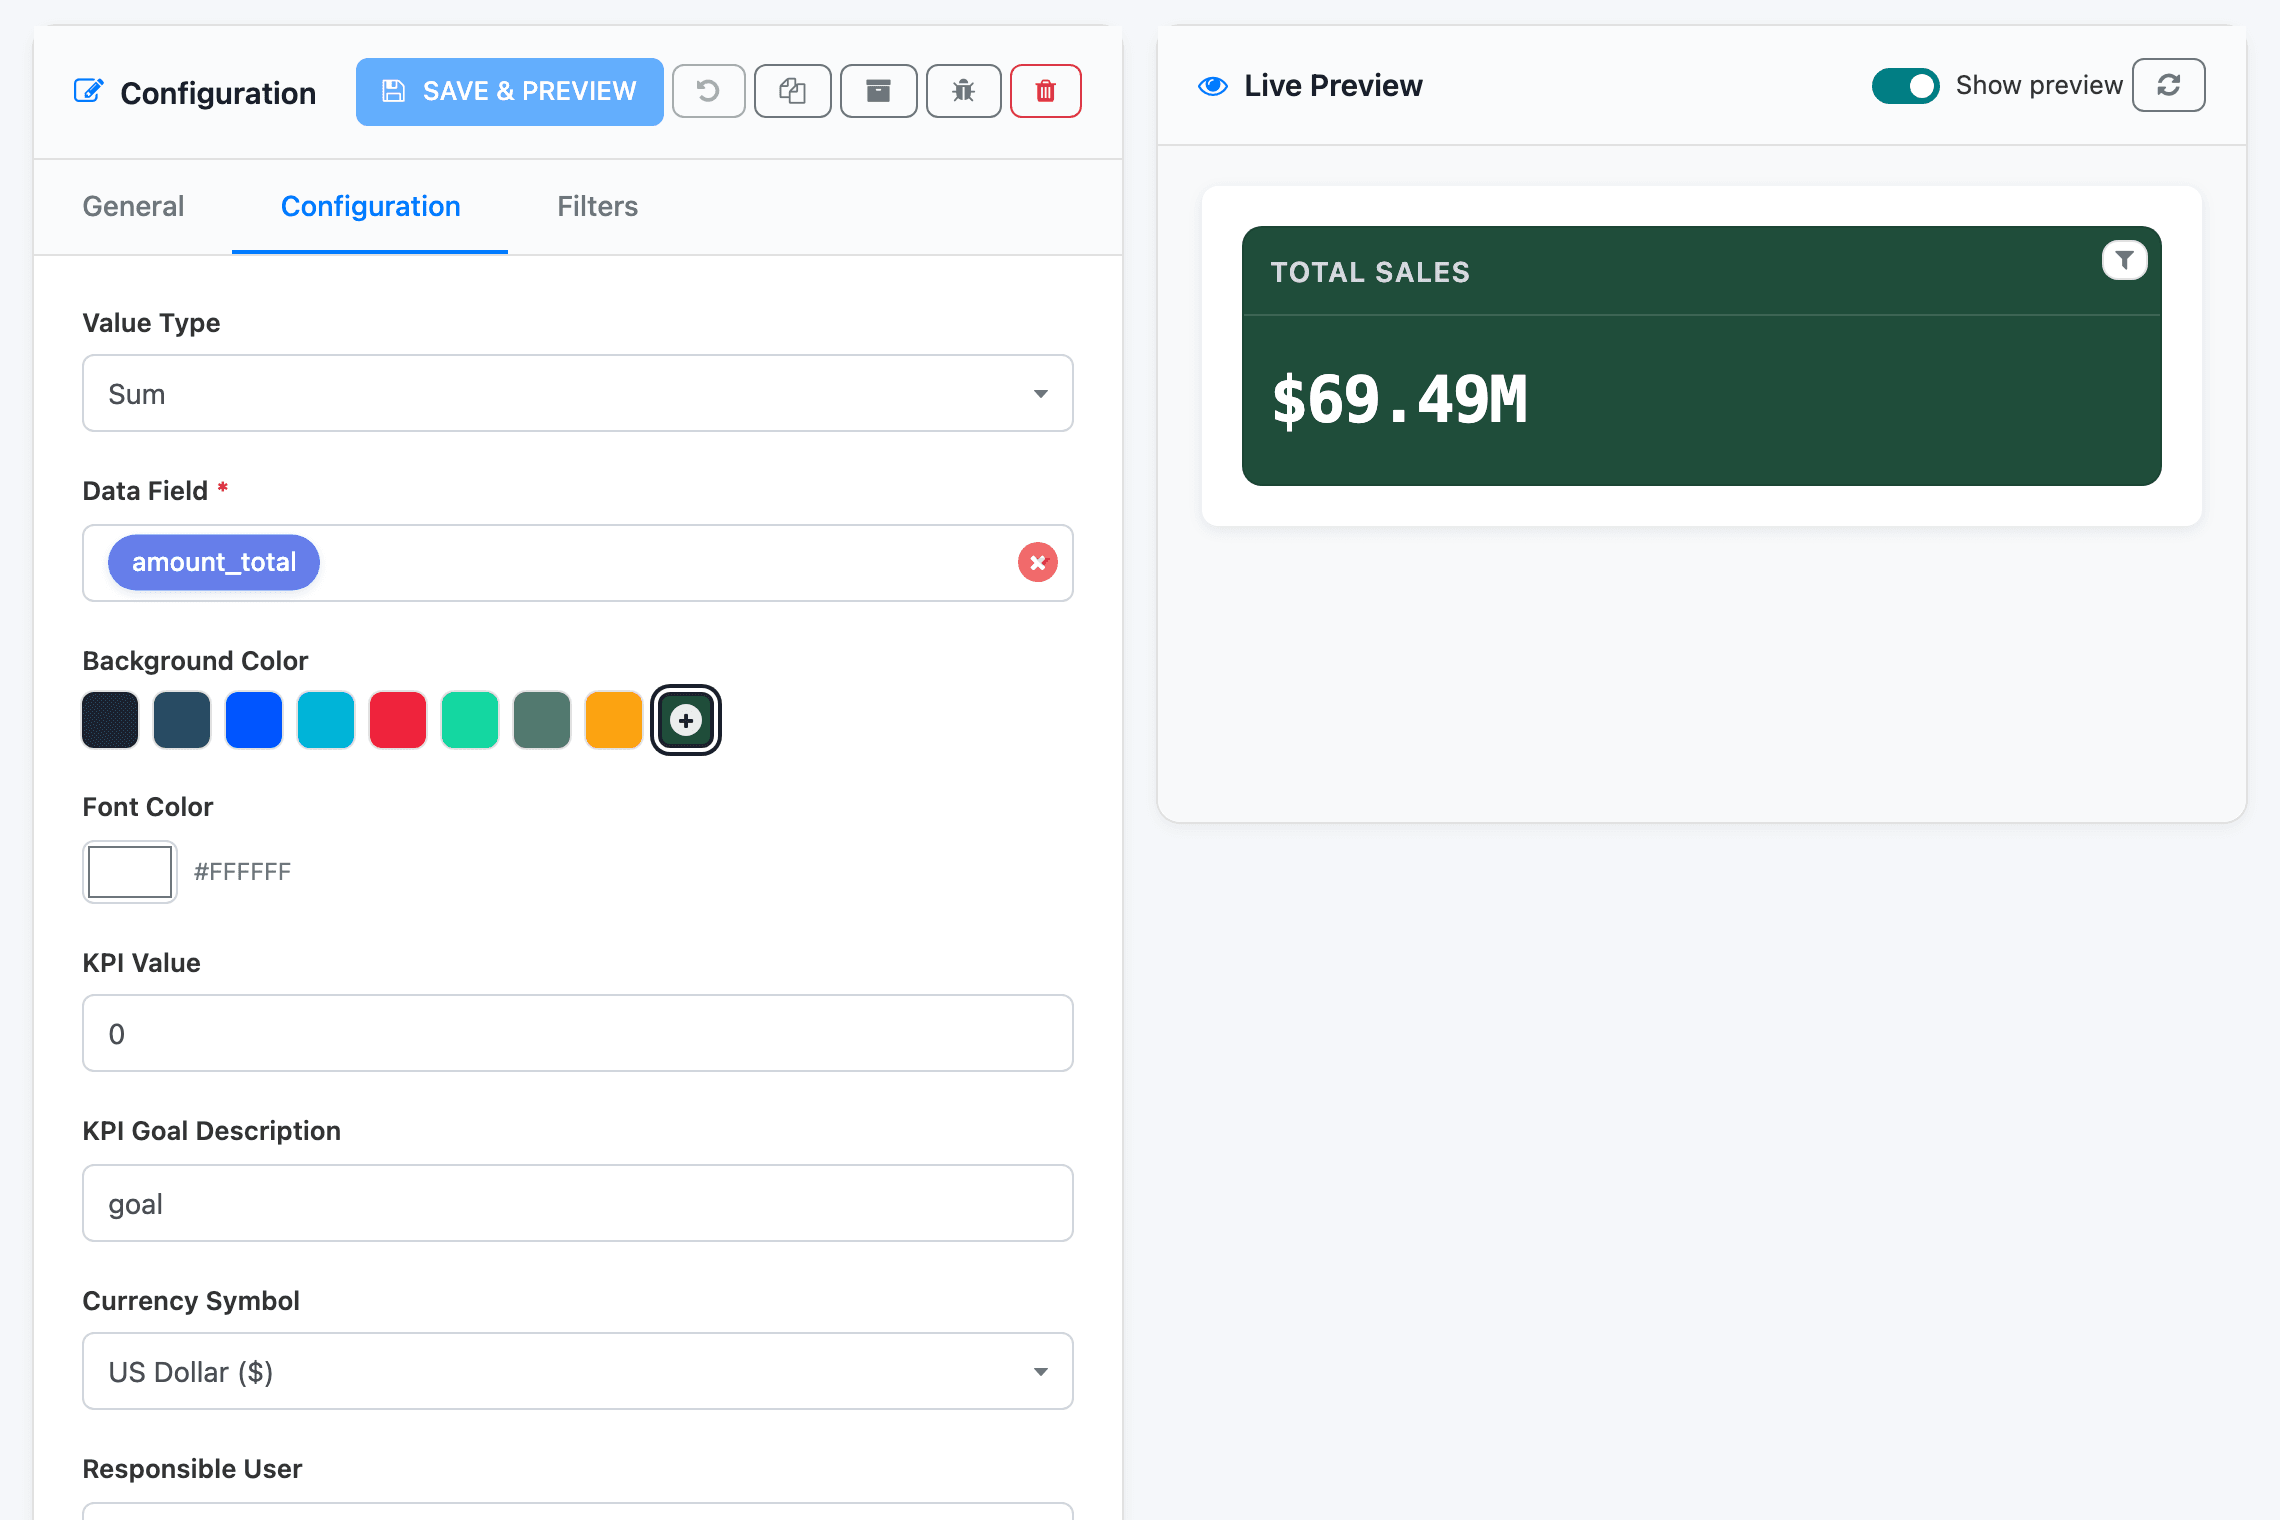
Open the Configuration tab. Set Value Type to Sum and Data Field to amount_total.
-
Pick a Background Color and a Currency Symbol. The colours change in the preview straight away.
-
Click Save & Preview. If the preview panel says Live preview is off, click Turn on preview.
Count only confirmed orders
Section titled “Count only confirmed orders”Right now the tile adds up quotations and cancelled orders too. A fixed filter fixes that.
-
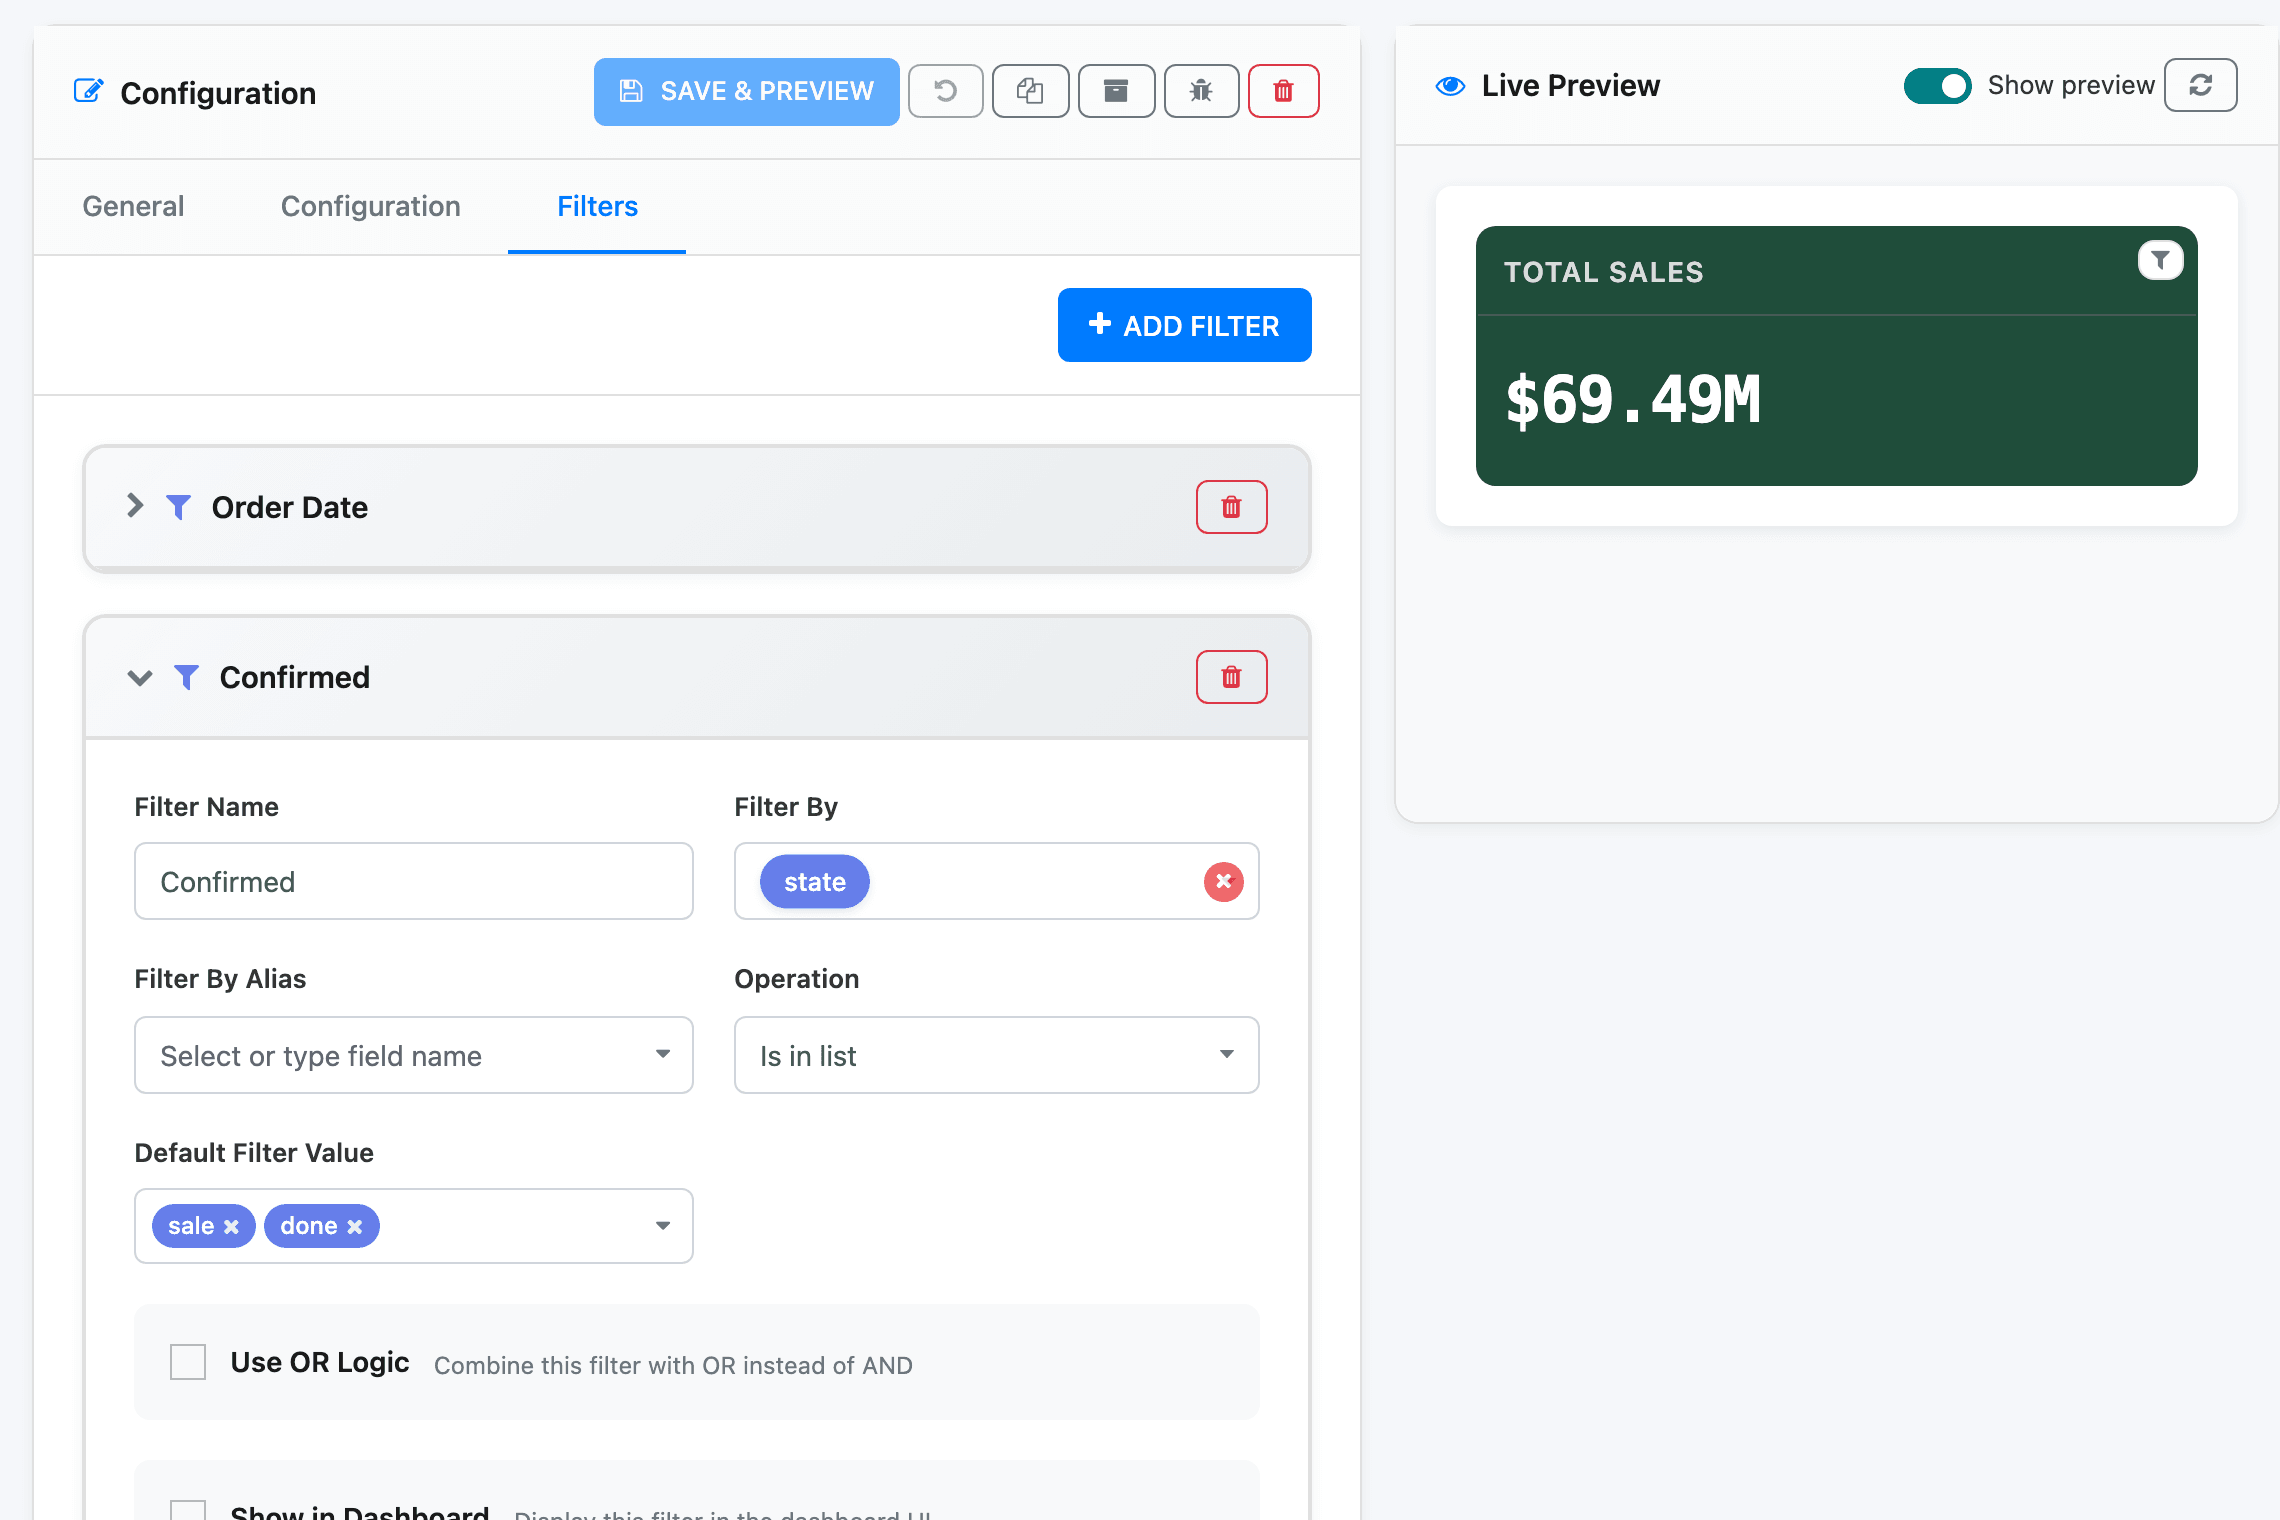
Open the Filters tab and click Create Your First Filter.
-
Set Filter Name to Confirmed, Filter By to state, and Operation to Is in list.
-
In Default Filter Value, pick sale and done. The picker lists the values that exist in your data.
-
Leave Show in Dashboard unticked, so the condition always applies and viewers don’t see it.
-
Click Save & Preview.
3. Add a monthly chart
Section titled “3. Add a monthly chart”-
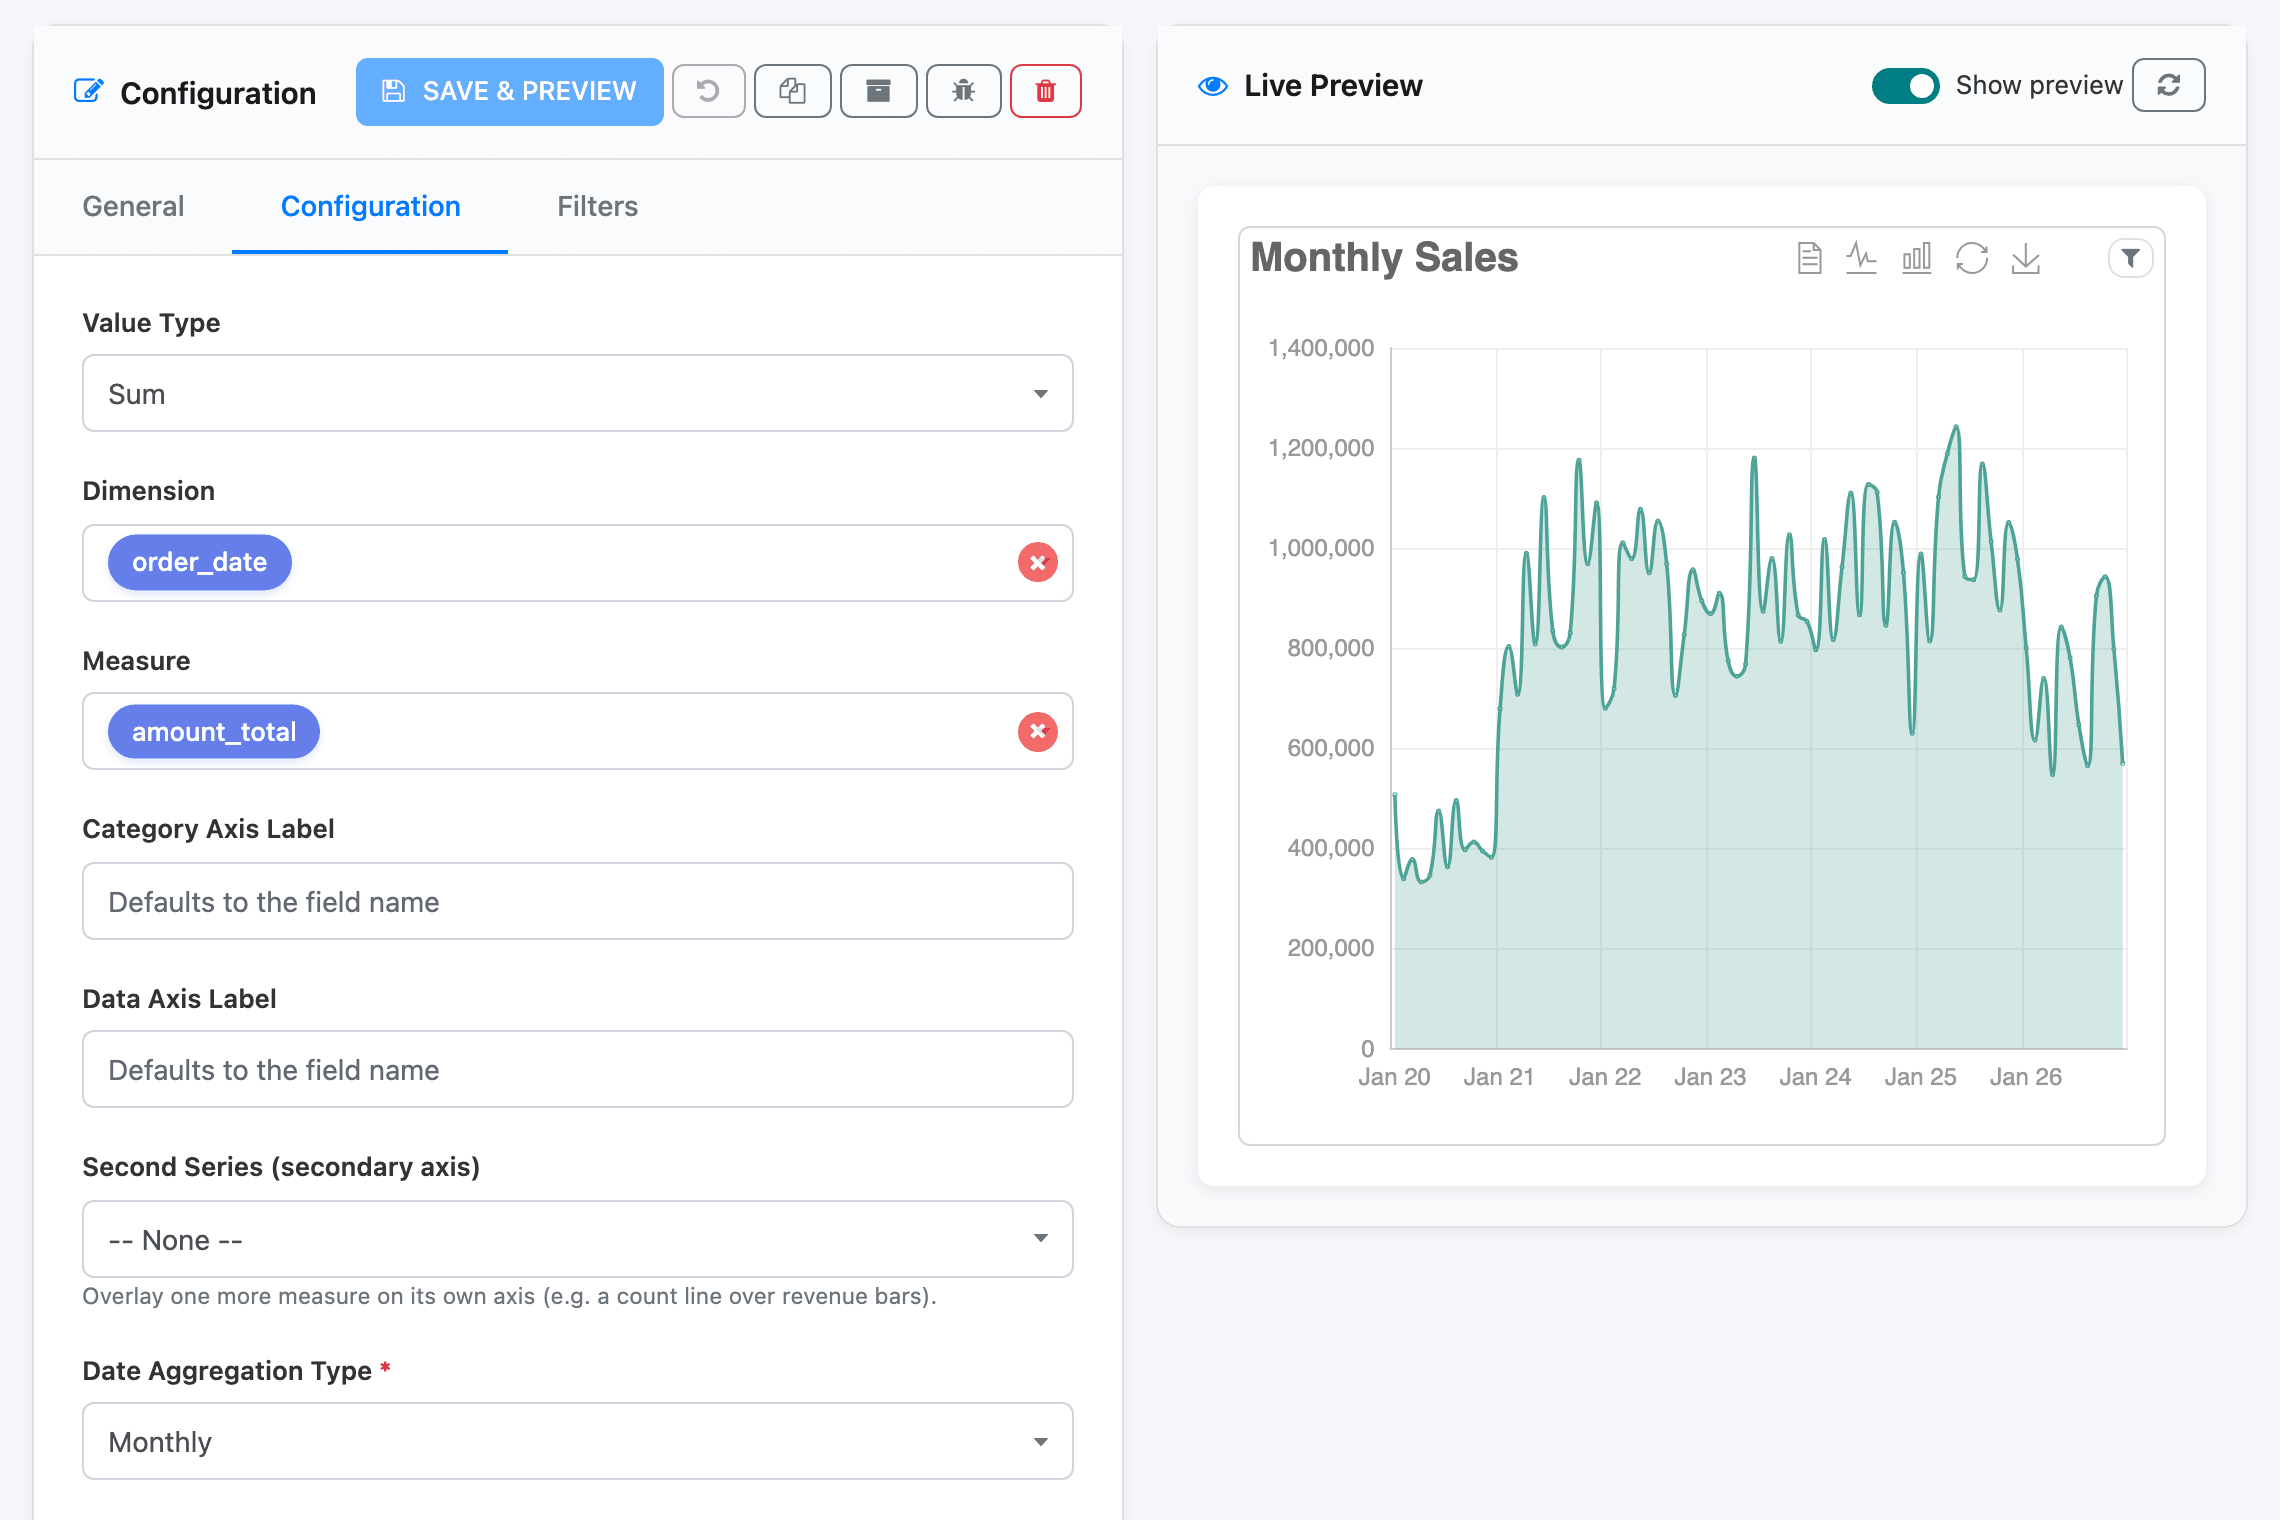
Click New Item and name it Monthly Sales.
-
Choose Area Chart as the Visualization Type and Sale Orders as the data source.
-
On the Configuration tab, set:
- Value Type: Sum
- Dimension: order_date
- Date Aggregation Type: Monthly (it appears once the dimension is a date)
- Measure: amount_total
-
Add the same Confirmed filter as on the tile, so both widgets count the same orders.
-
Click Save & Preview.
4. Let viewers pick the dates
Section titled “4. Let viewers pick the dates”A date filter that viewers can change has two parts: a date filter line on each widget, and the dashboard’s Date Filter in the header, which drives them all.
-
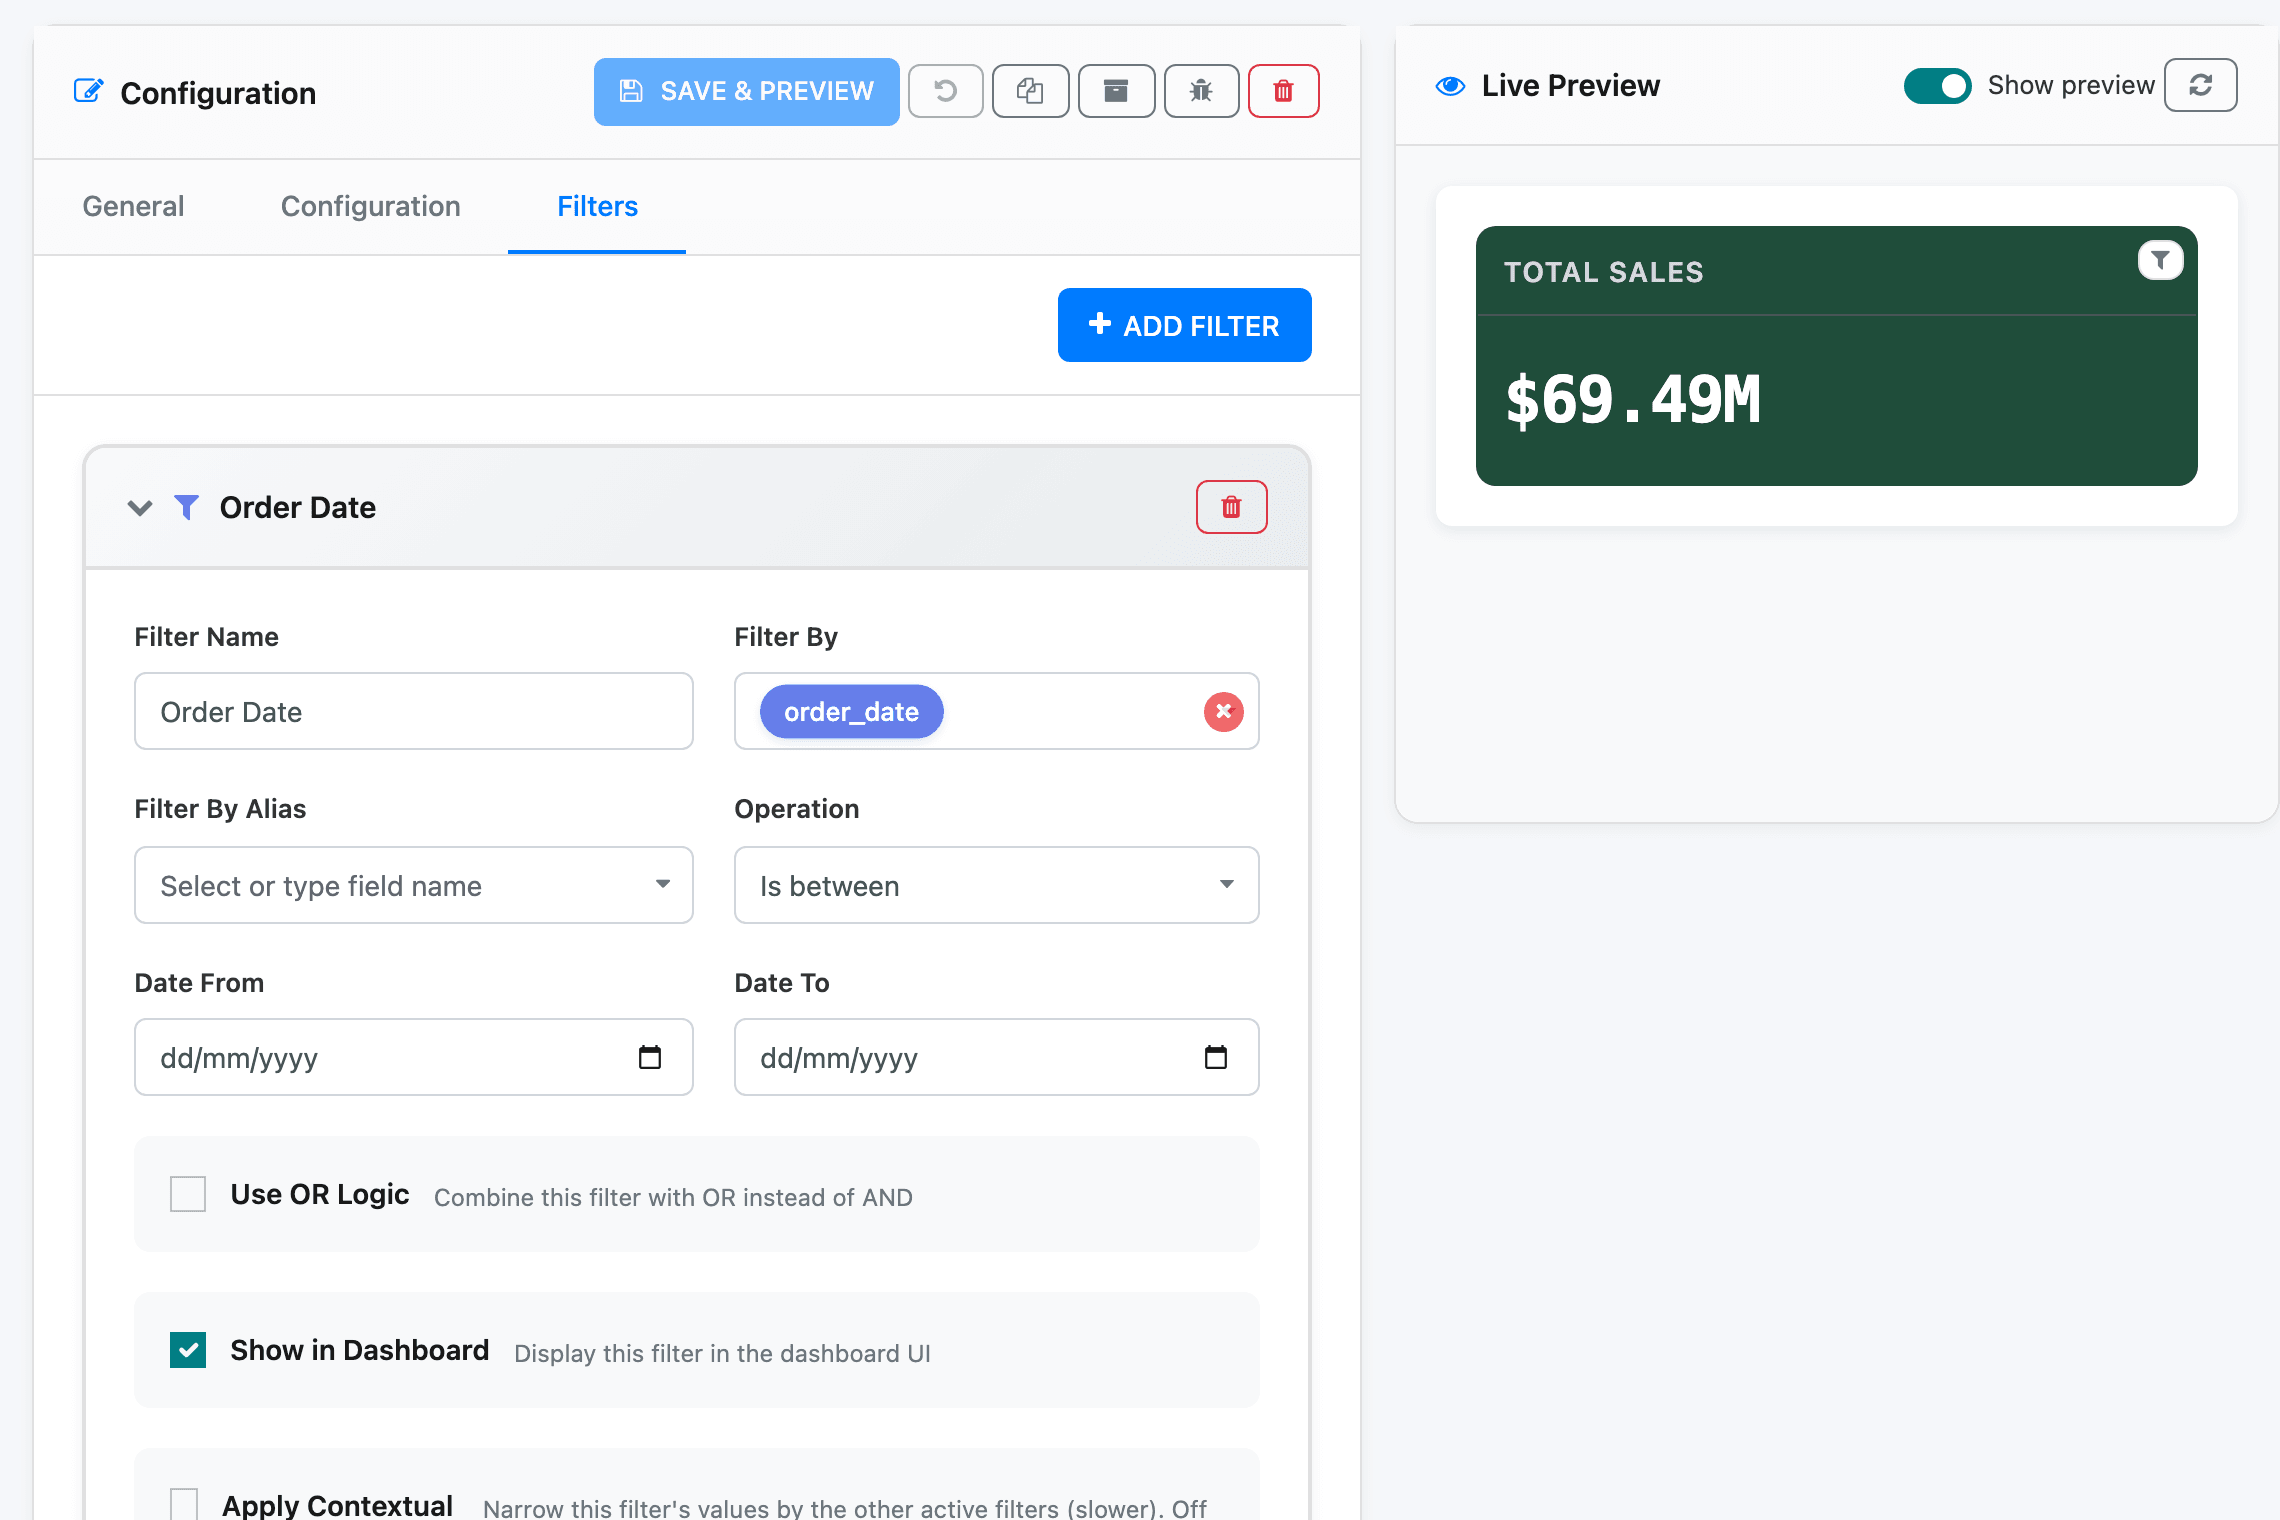
Select Total Sales, open Filters, and click Add Filter.
-
Set Filter Name to Order Date, Filter By to order_date, and Operation to Is between. Tick Show in Dashboard and keep Range Mode on. Leave Date From and Date To empty to show all dates until someone picks a range.
-
Click Save & Preview, then add the same filter to Monthly Sales.
-
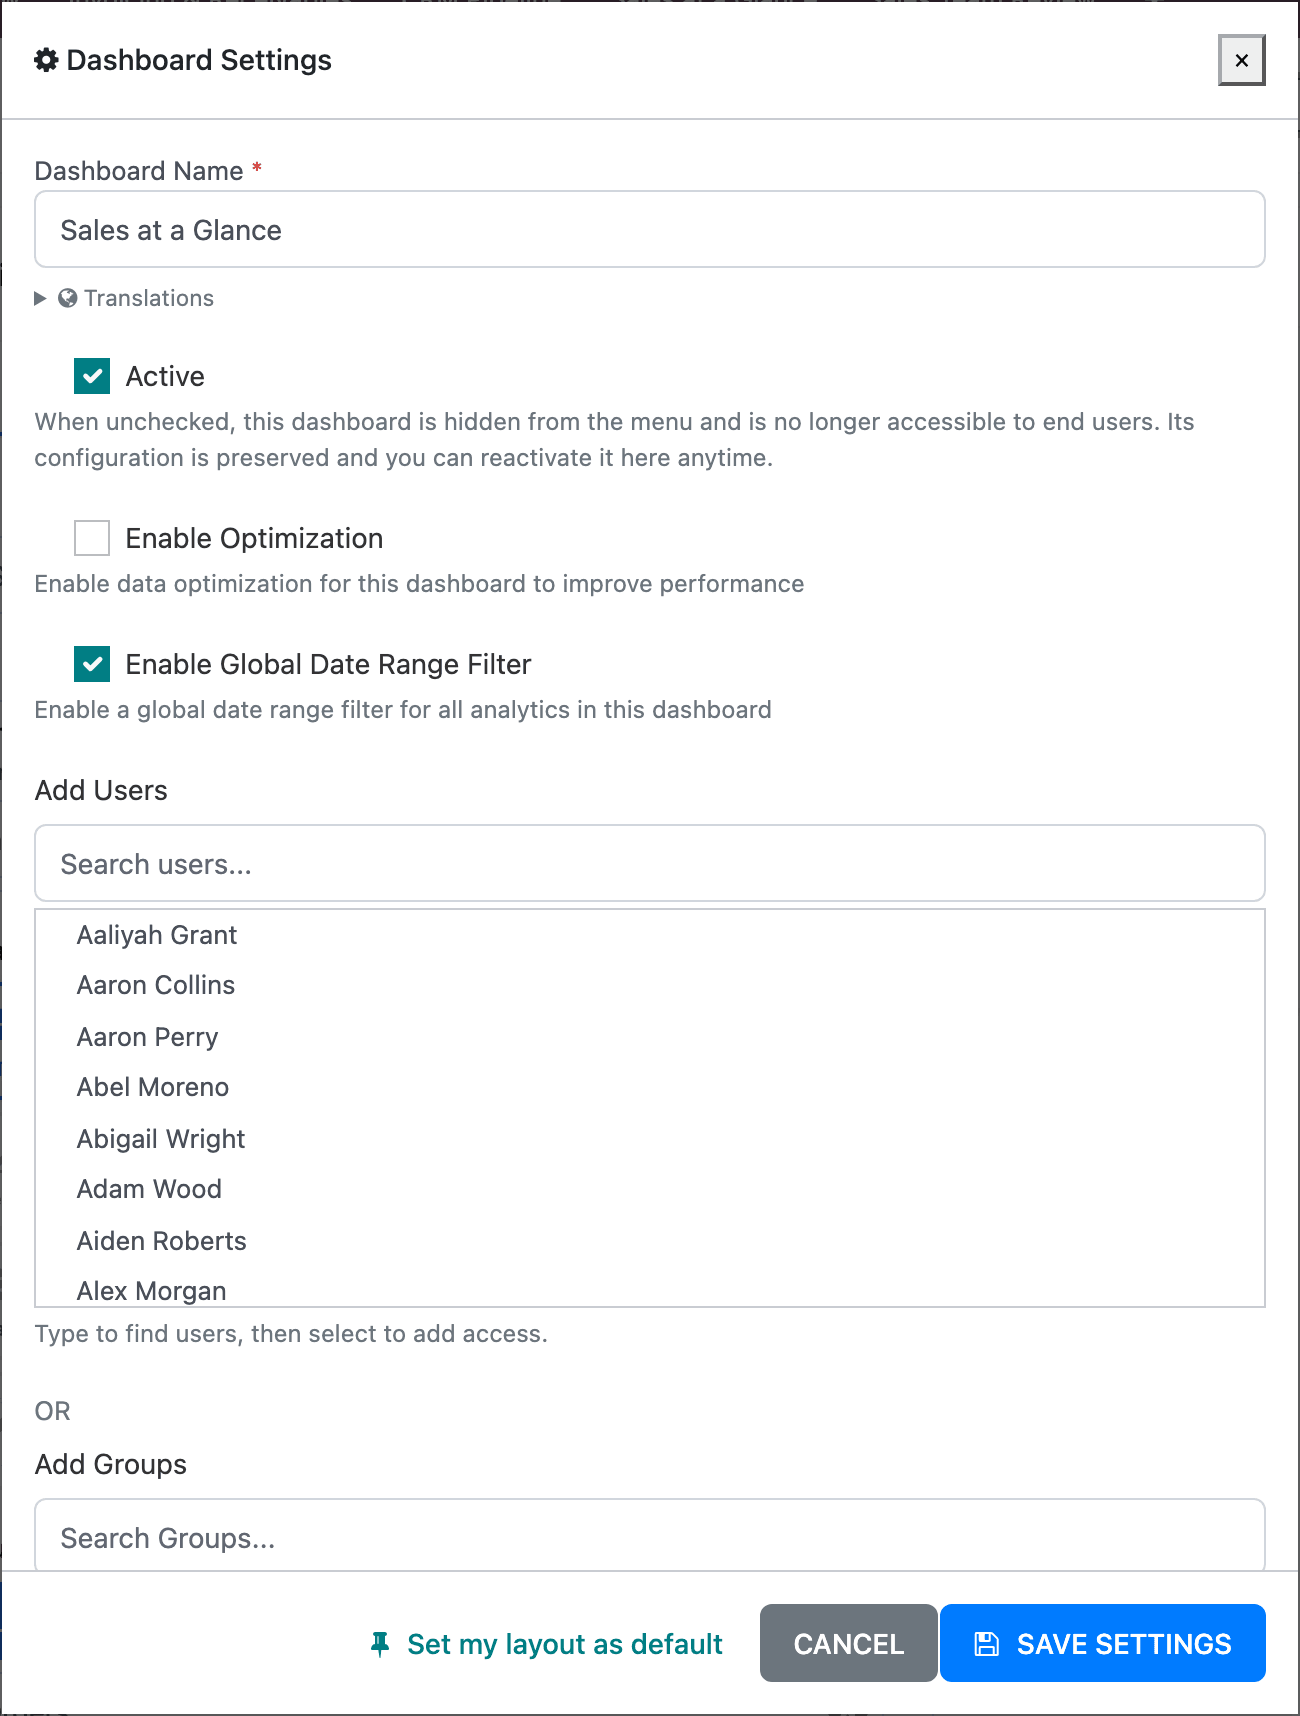
Click the cog in the top bar (Dashboard Settings), tick Enable Global Date Range Filter, and click Save Settings.
5. Arrange the dashboard
Section titled “5. Arrange the dashboard”-
Click View Dashboard in the top bar. The dashboard opens in a new tab.
-
Click the lock in the top-left corner (Edit layout). Drag the chart next to the tile, and drag a widget’s bottom-right corner to resize it.
-
Click the lock again (Lock and save layout).
-
Back in the builder, open Dashboard Settings and click Set my layout as default, so everyone starts from your arrangement.
Try the Date Filter in the header: pick This Year, and both widgets update at once. There is no Apply button; filters apply as soon as you pick.
6. Share it
Section titled “6. Share it”-
In the builder, open Dashboard Settings.
-
Under Add Users, type a colleague’s name and click them in the list. To share with many people at once, use Add Groups.
-
Click Save Settings.
They’ll find Sales at a Glance in their Odoo Dashboards menu after reloading the page.
Where to go next
Section titled “Where to go next”- Learn how datasets, widgets, dashboards and filters relate in How it fits together.
- Read the tour for every control in the viewer and the builder.