

Build a table
A table is the widget to use when people need to read the numbers row by row: a product ranking, a list of open orders, a customer statement. Viewers can search it, sort it, group it, export it and click a row to open the records behind it.
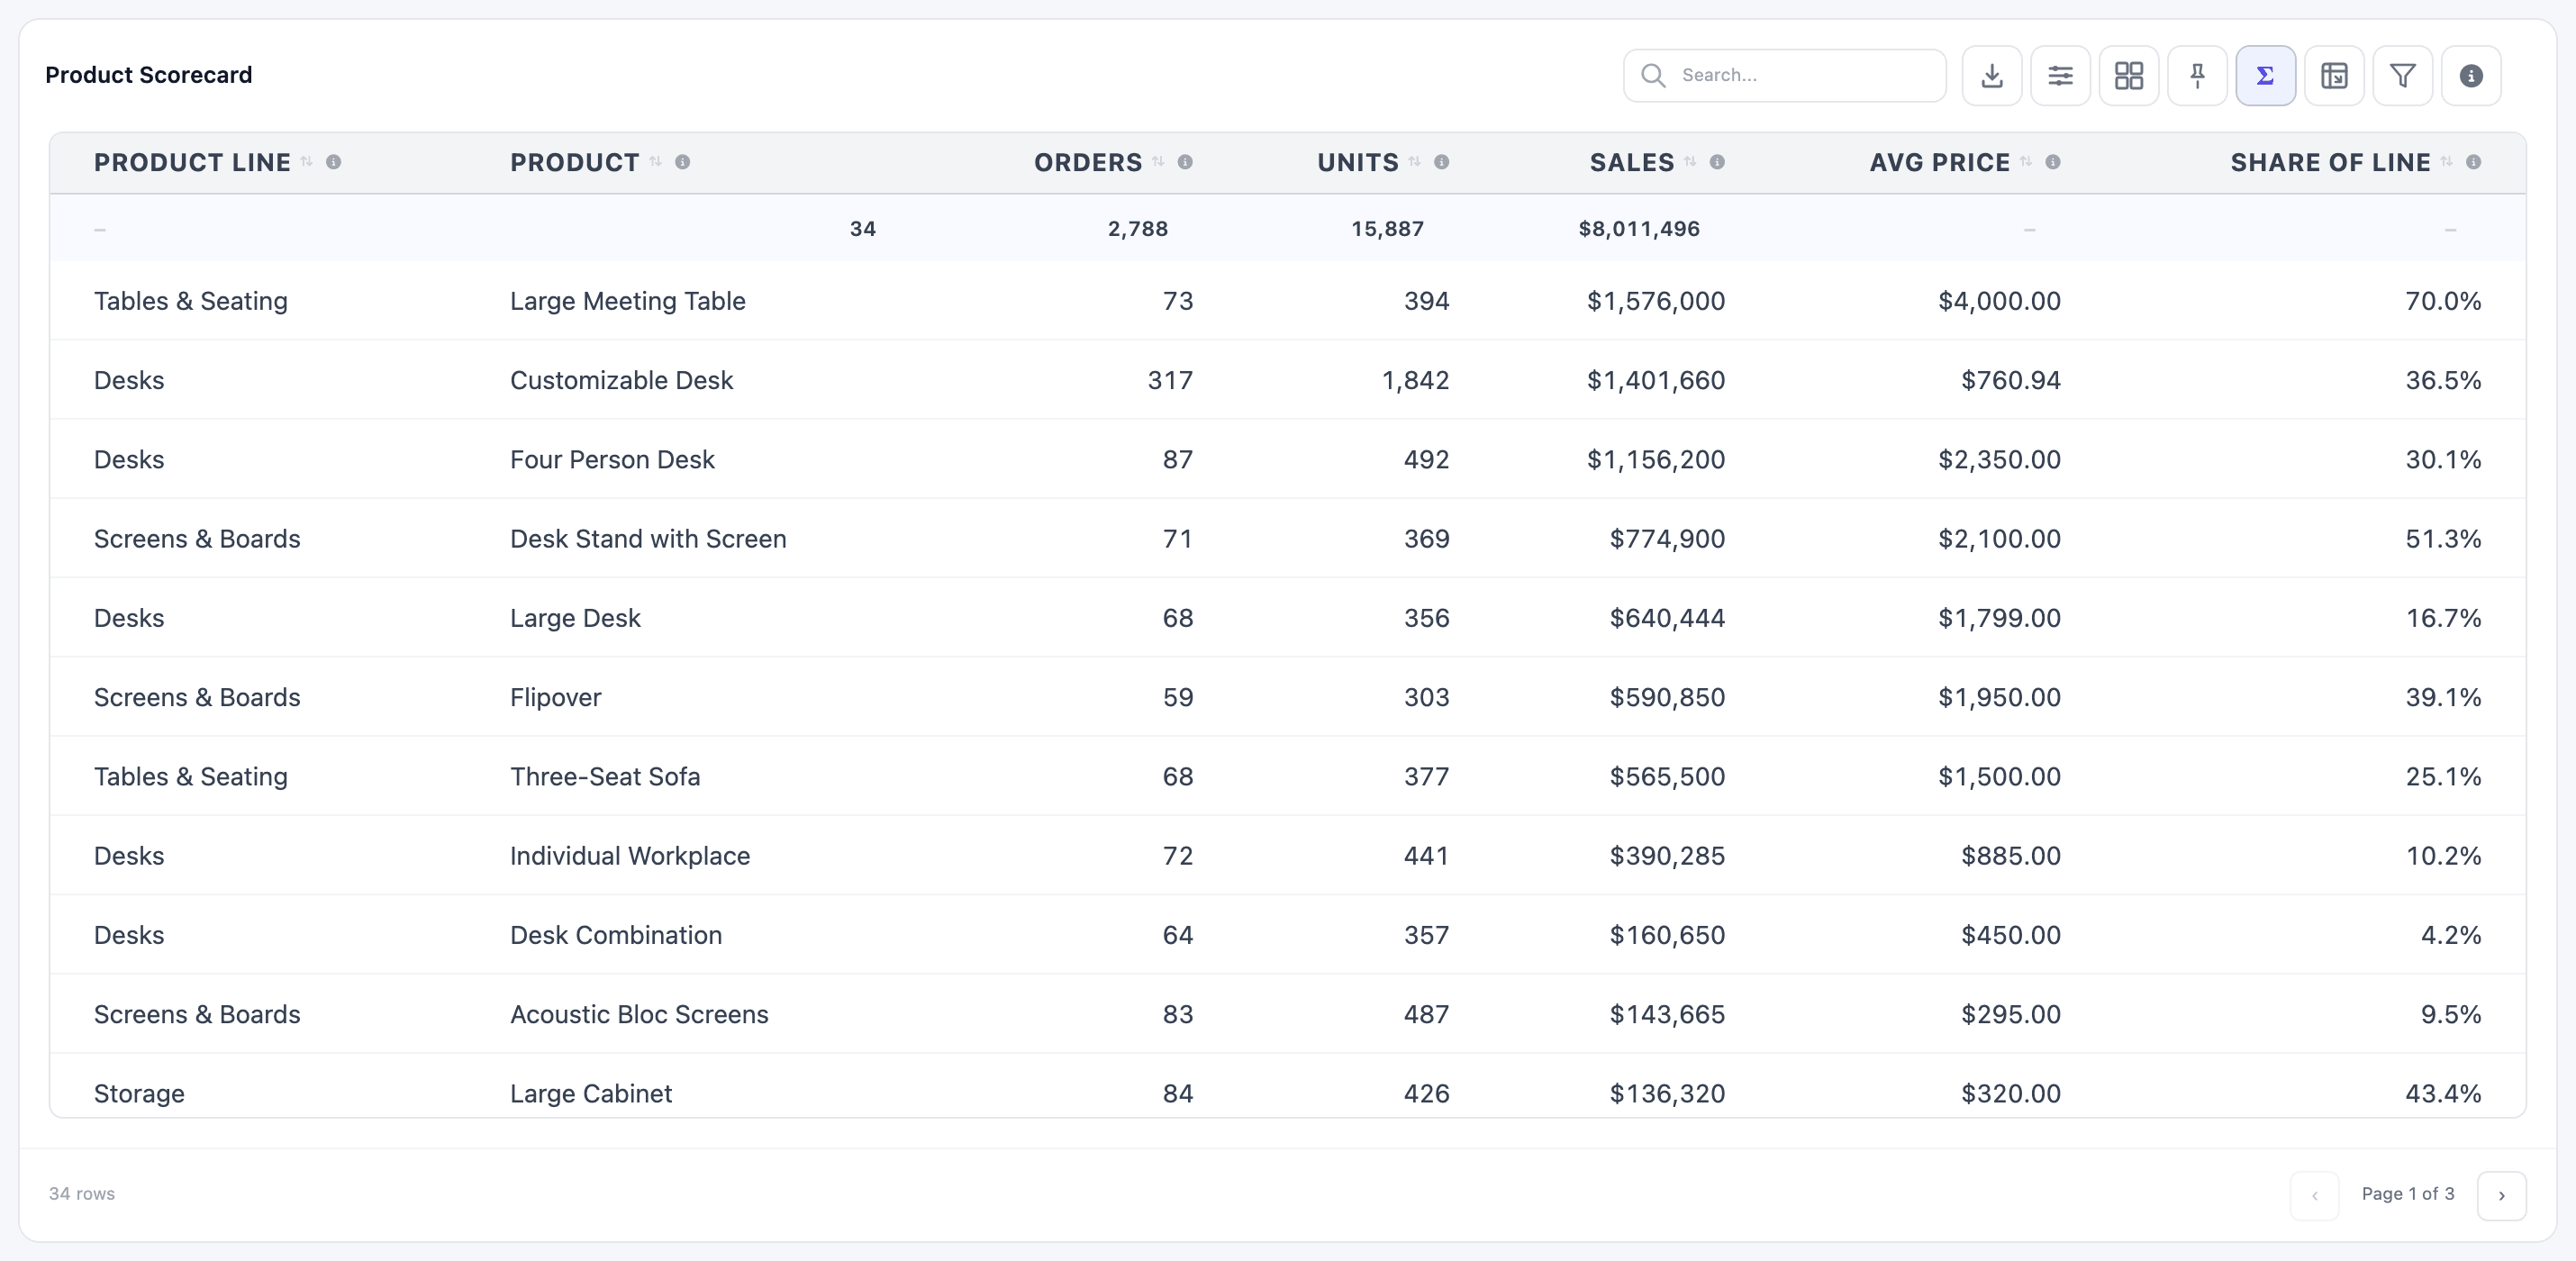
The examples in this section come from a dashboard called Furniture Sales Analysis. Its first table, Product Scorecard, lists each product with its orders, units, sales, average price and share of its product line.
Create the table
Section titled “Create the table”-
In the Dashboard Builder, open the dashboard and click New Item.
-
On the General tab, type a Name, choose Table as the Visualization Type, and pick a dataset under Data Source.
-
Open the Configuration tab and click Add Column (or Add First Column on an empty table).
-
In the new row, pick a field in Field. Alias, the header viewers see, fills in from the field name (
product_linebecomes Product Line); type over it to change it. -
Repeat for every column, then click Save & Preview. If the preview panel says Live preview is off, click Turn on preview.
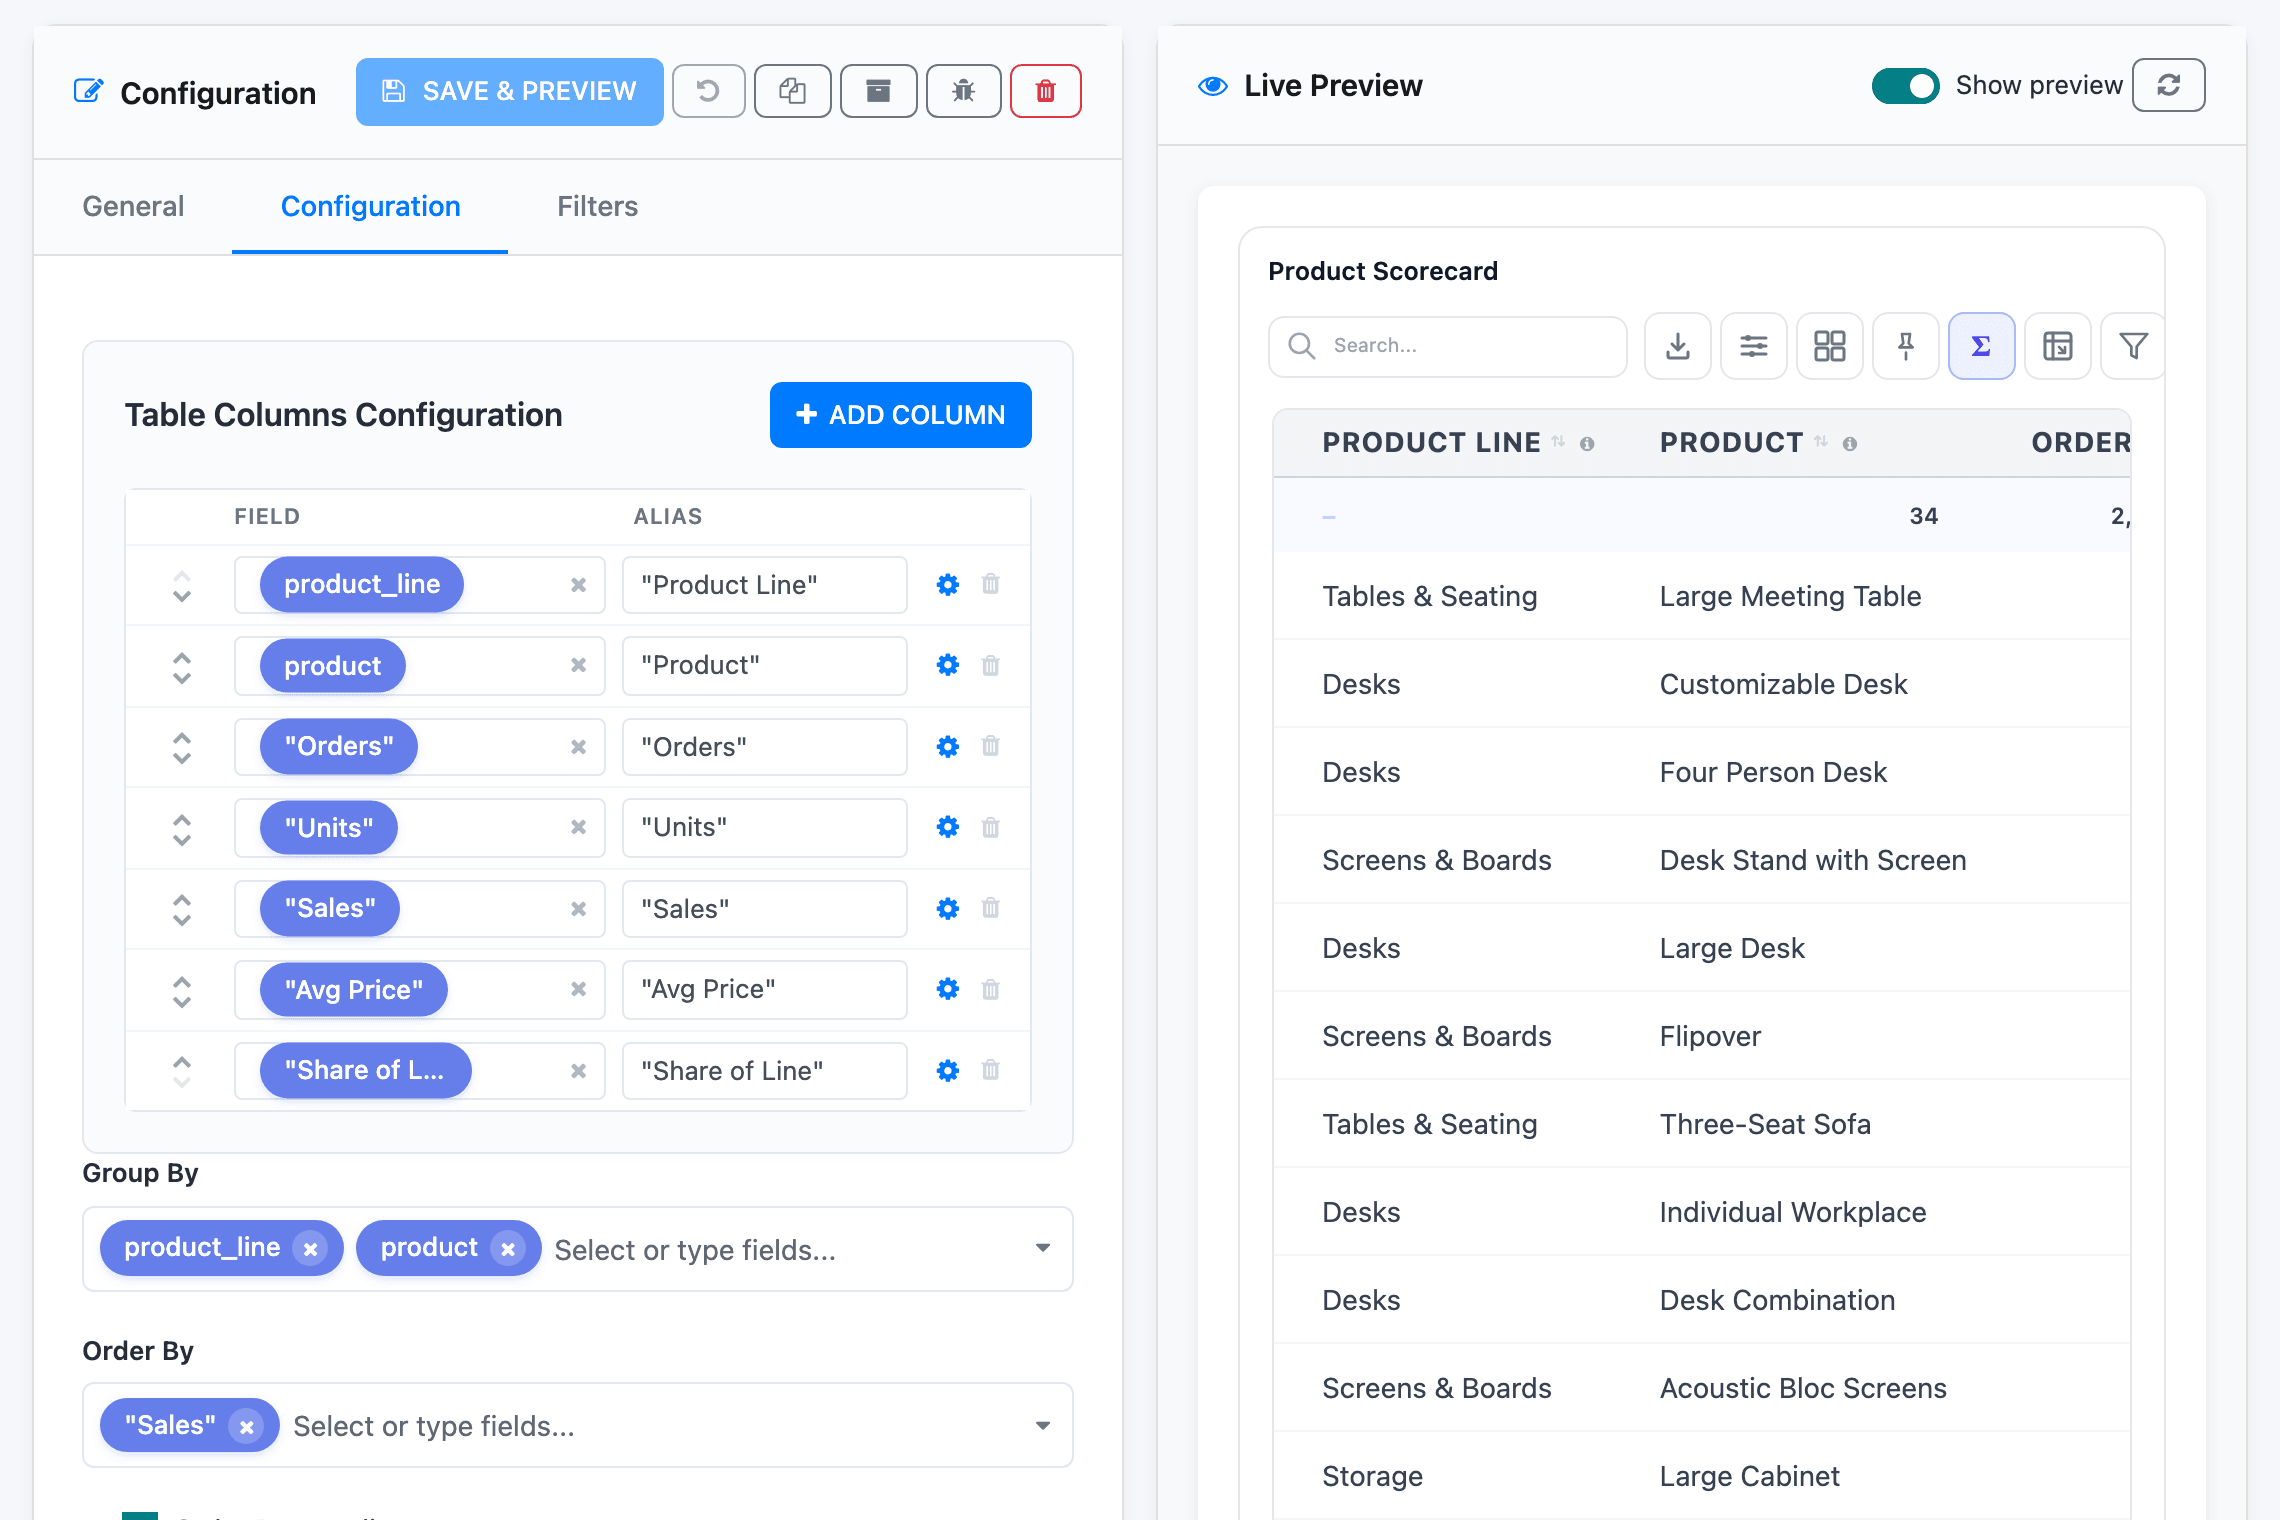
Each column row has, from left to right:
- Move Up and Move Down arrows, which set the column order.
- Field, a searchable list of the dataset’s fields. The × clears it.
- Alias, the column header. Leave it empty to use the field name. After you save, the builder shows each alias between double quotes; viewers never see the quotes.
- A gear (Column settings) for number formats, tooltips, colours and rules. See Column settings.
- A bin (Delete Column).
The preview shows the item as it was last saved, so click Save & Preview after each change to see it.
What a column can hold
Section titled “What a column can hold”| Column | How you add it |
|---|---|
| A dataset field | Pick it in Field. |
| A calculated field | Choose Custom… at the bottom of the Field list. The Create Custom Field window builds sums, ratios, conditions, formatted dates and combined text without SQL. The Field Label you give it becomes the header. |
| A typed expression | Type an SQL expression such as SUM(quantity) in Field and press Enter. The builder fills Alias from it (Sum(quantity)), so type a readable header there. |
| A target | Tick a plan under Target Plans on the General tab, then add its target_… column. Tables only. |
Custom fields belong to this one widget. Another table on the same dataset doesn’t see them.
Plain rows or summarised rows
Section titled “Plain rows or summarised rows”A table either lists the dataset’s rows as they are, or summarises them into one row per group.
- Plain rows: every column is a plain field, such as order reference, customer and amount. Leave Group By empty. Each dataset row becomes a table row.
- Summarised rows: at least one column adds things up, such as a custom field with SUM or COUNT. Every other column must then be listed in Group By, and the table shows one row per combination of those values.
Product Scorecard is summarised: Orders, Units, Sales, Avg Price and Share of Line add up order lines, so Group By holds product_line and product, the two plain columns. That gives one row per product.
If a plain column is missing from Group By, the builder says which one and won’t show a preview:
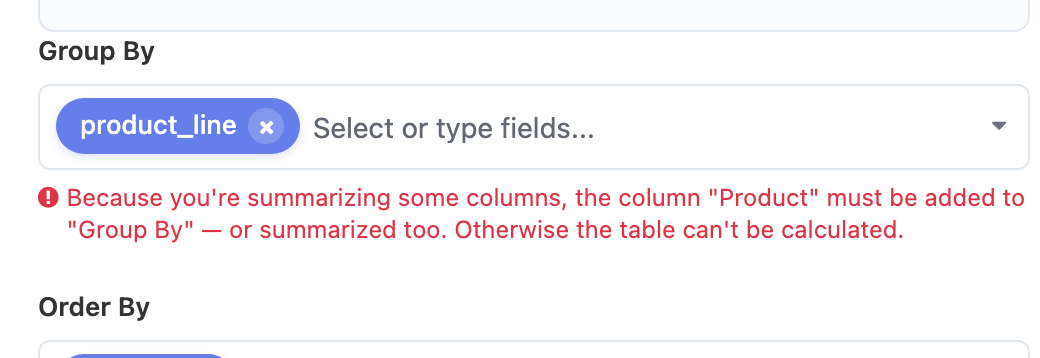
Add the column to Group By (or summarise it too) and save again. The item is still saved when this message shows, with the toast Saved as draft — complete the highlighted fields to see a preview., but the dashboard can’t calculate it until you fix it.
Sort order, row limit and page size
Section titled “Sort order, row limit and page size”These settings sit under the column list on the Configuration tab.
| Setting | What it does |
|---|---|
| Order By | The fields the rows are sorted by when the table loads. Pick fields or type an expression; with several, the first sorts first. |
| Order Descending | Sorts from largest to smallest. It applies to the last field in Order By only; the ones before it stay A to Z. Order By sales_team, "Sales" with Order Descending gives teams in alphabetical order, each with its best sellers first. |
| Limit Data | Keeps only the first N rows, after sorting. 0 keeps every row. Combine it with Order By for a top 10. |
| Page Length | The number of rows per page the table starts with. In practice, the viewer then fits as many rows as the widget’s height allows, and recalculates when the widget is resized. |
Viewers can re-sort by clicking a column header. That only changes their own view and is reset when the page reloads.
Everything a viewer does in the table (search, sort, column filters, grouping, totals, export) works on the rows the table loaded. With Limit Data set to 10, a search finds nothing outside those 10 rows.
The footer shows the row count and Page X of Y with ‹ and › buttons. To show every row on one scrolling page instead, tick Hide footer (row count + pagination) under Advanced. See The viewer toolbar.
Other table settings
Section titled “Other table settings”The Configuration tab has three folding sections under these settings:
- Drilldown Options: open the Odoo records behind a row when a viewer clicks it. See Drilldown.
- Row Actions: let viewers select rows and run an action on their records. See Row actions.
- Advanced: totals, transpose, default grouping, pinned columns and which toolbar buttons viewers get.
Next steps
Section titled “Next steps”- Format the columns: currency, decimals, percentages, tooltips and alignment.
- Colour cells by value.
- Add a totals row and a share of group column.
- Show the top N rows per group.