

Compare with the previous period
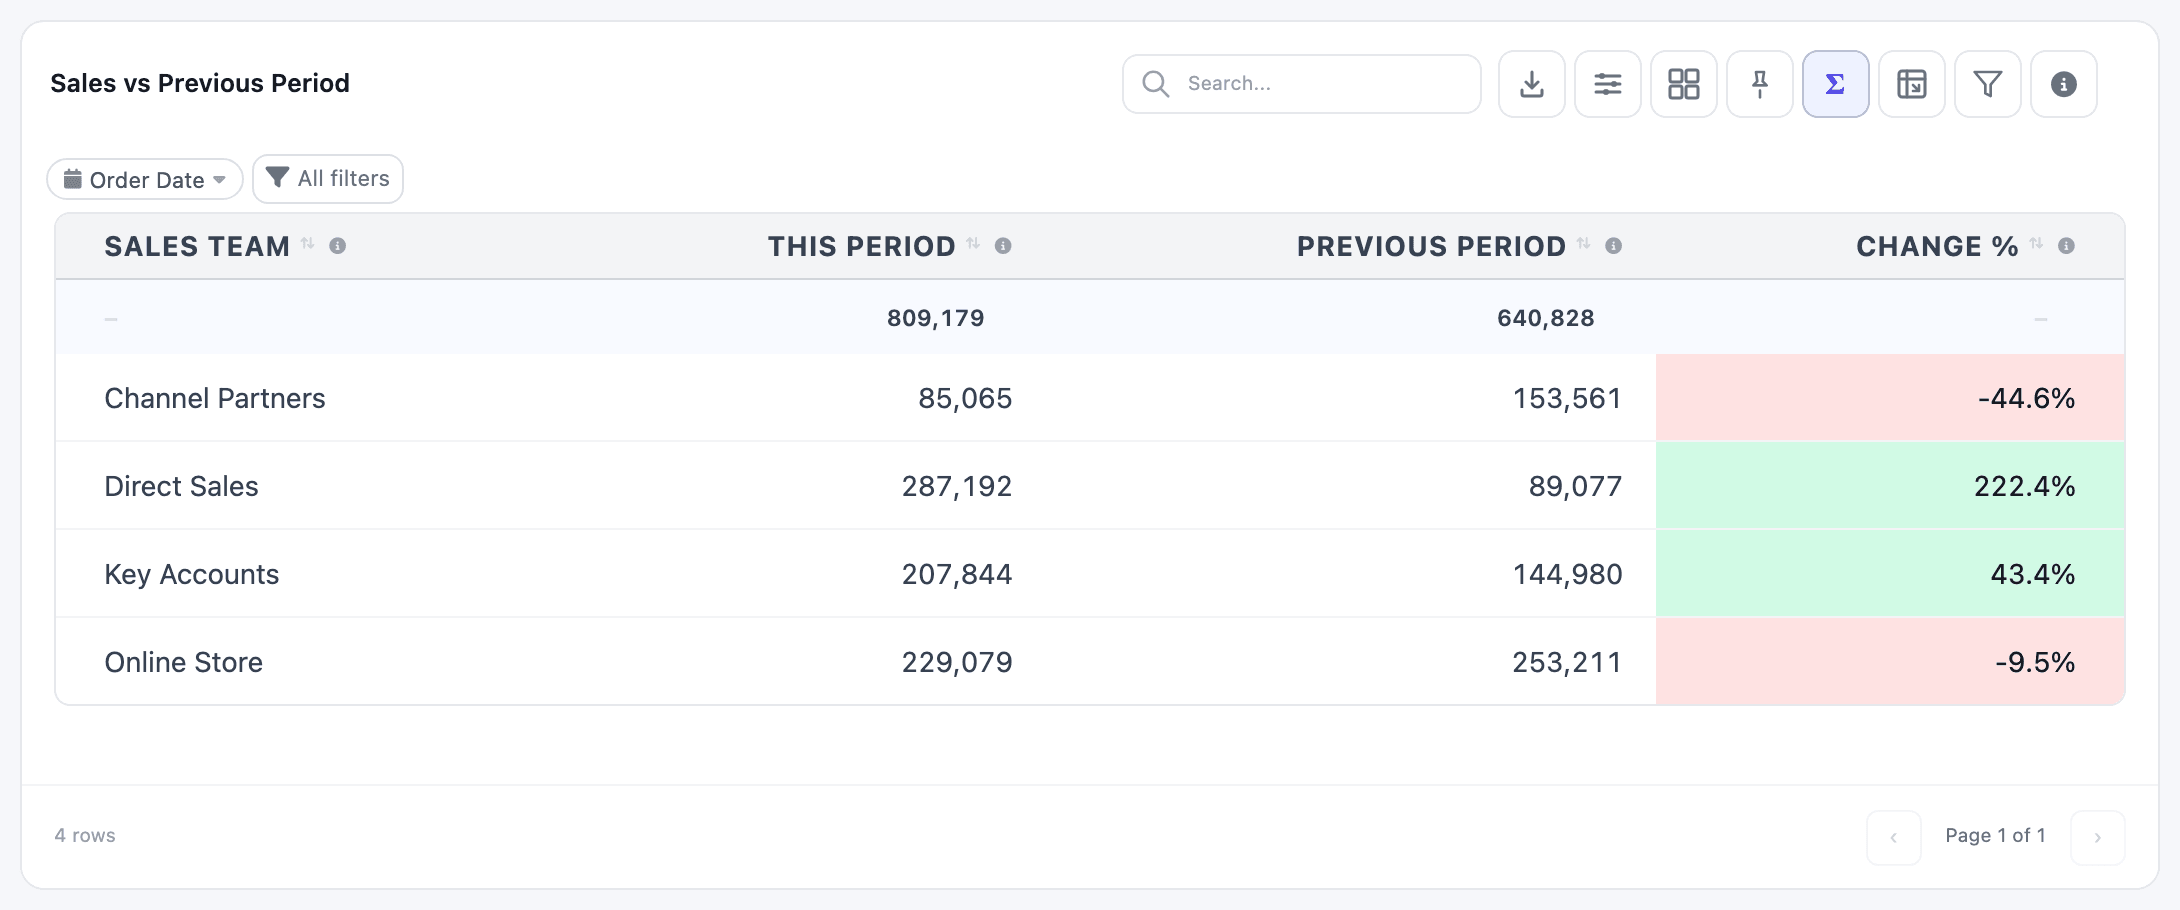
Managers rarely ask “what were sales?” on its own. They ask “what were sales, and is that more or less than before?” This recipe builds a table that answers both for whatever dates the viewer picks: this period, the period just before it, and the change.
How it works
Section titled “How it works”A normal date filter keeps only the rows inside the picked range, which throws away the previous period. Here the date filter keeps every row up to the end of the picked range instead, and each column picks out its own slice of dates:
- This Period adds up the rows from the picked start date.
- Previous Period adds up the same number of days just before the start date.
The columns know the picked dates through two tokens, {{date_from:<key>}} and {{date_to:<key>}}, which the app replaces with the dates picked on one particular date filter.
What you need
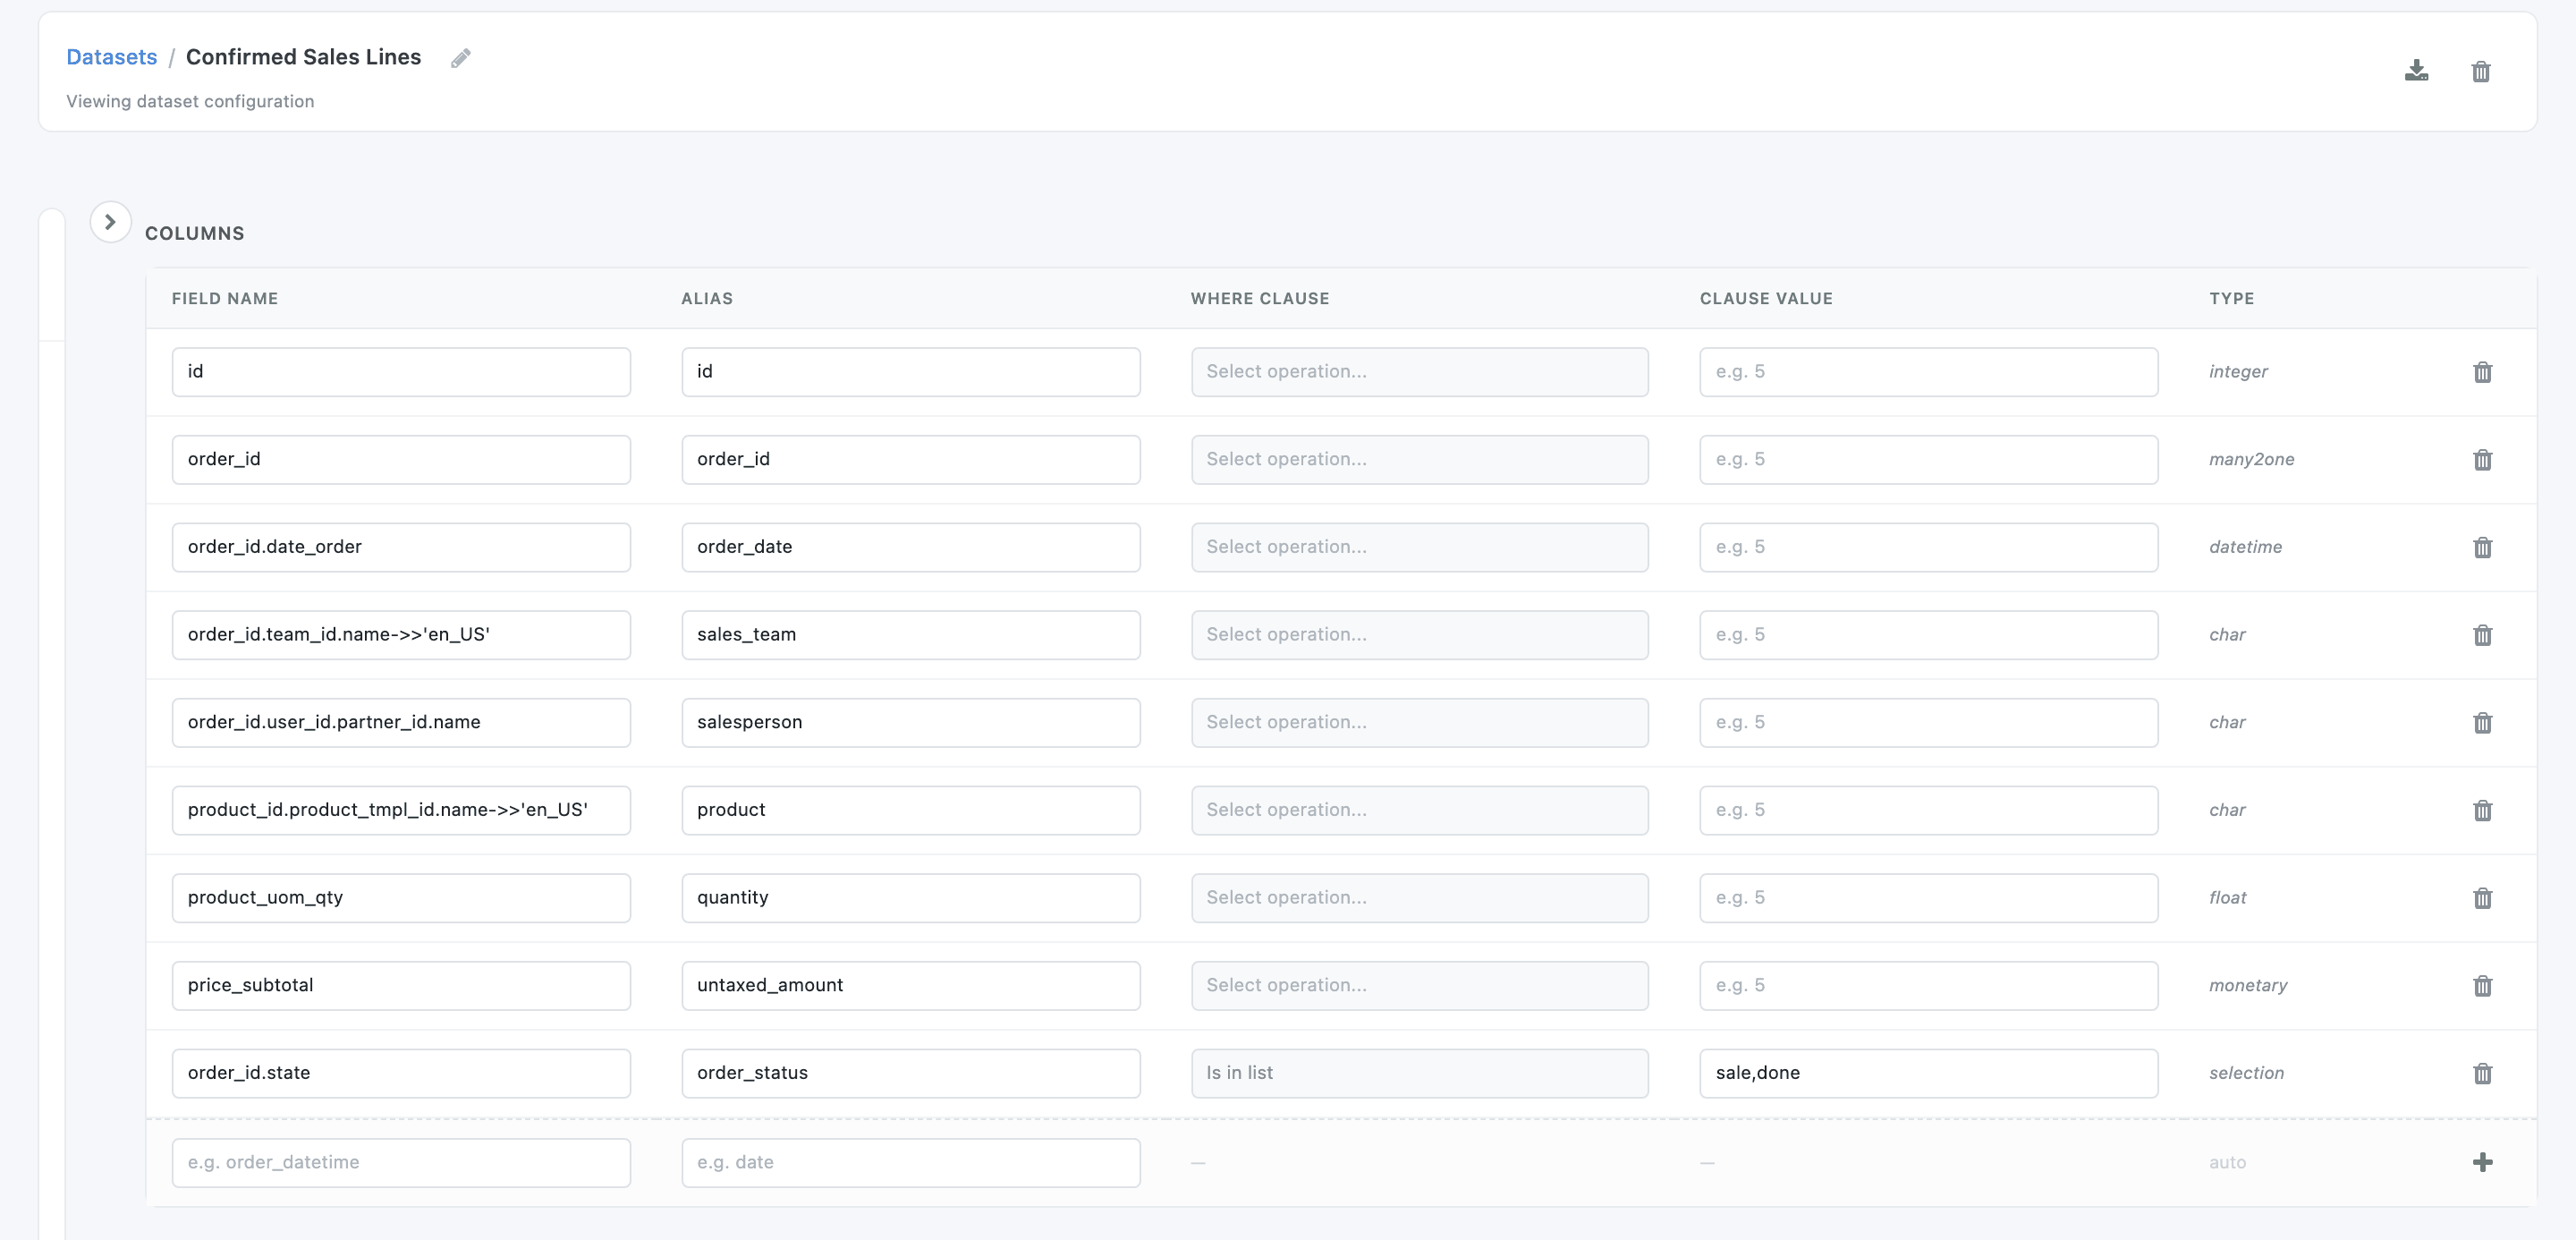
Section titled “What you need”A dataset with an order date, the amount, and whatever you want rows for. This recipe uses Confirmed Sales Lines, built on the Sales Order Line model in the Dataset Builder (see Create a dataset):
| Field Name | Alias | Where Clause | Clause Value |
|---|---|---|---|
id |
id |
||
order_id |
order_id |
||
order_id.date_order |
order_date |
||
order_id.team_id.name |
sales_team |
||
order_id.user_id.partner_id.name |
salesperson |
||
product_id.product_tmpl_id.name |
product |
||
product_uom_qty |
quantity |
||
price_subtotal |
untaxed_amount |
||
order_id.state |
order_status |
Is in list | sale,done |
The Where Clause on order_status keeps confirmed orders only, so no widget on this dataset needs its own “confirmed” filter.
1. Add the date filter
Section titled “1. Add the date filter”-
In the Dashboard Builder, click New Item, name it Sales vs Previous Period, pick Table and the Confirmed Sales Lines dataset, and click Save & Preview.
-
Open the Filters tab and click Create Your First Filter.
-
Set Filter Name to Order Date, Filter By to order_date and Operation to Is up to range end. Leave Date From and Date To empty.
-
Tick Show in Dashboard, keep Range Mode on, and tick Strictly Follow Operator.
-
Click Save & Preview.
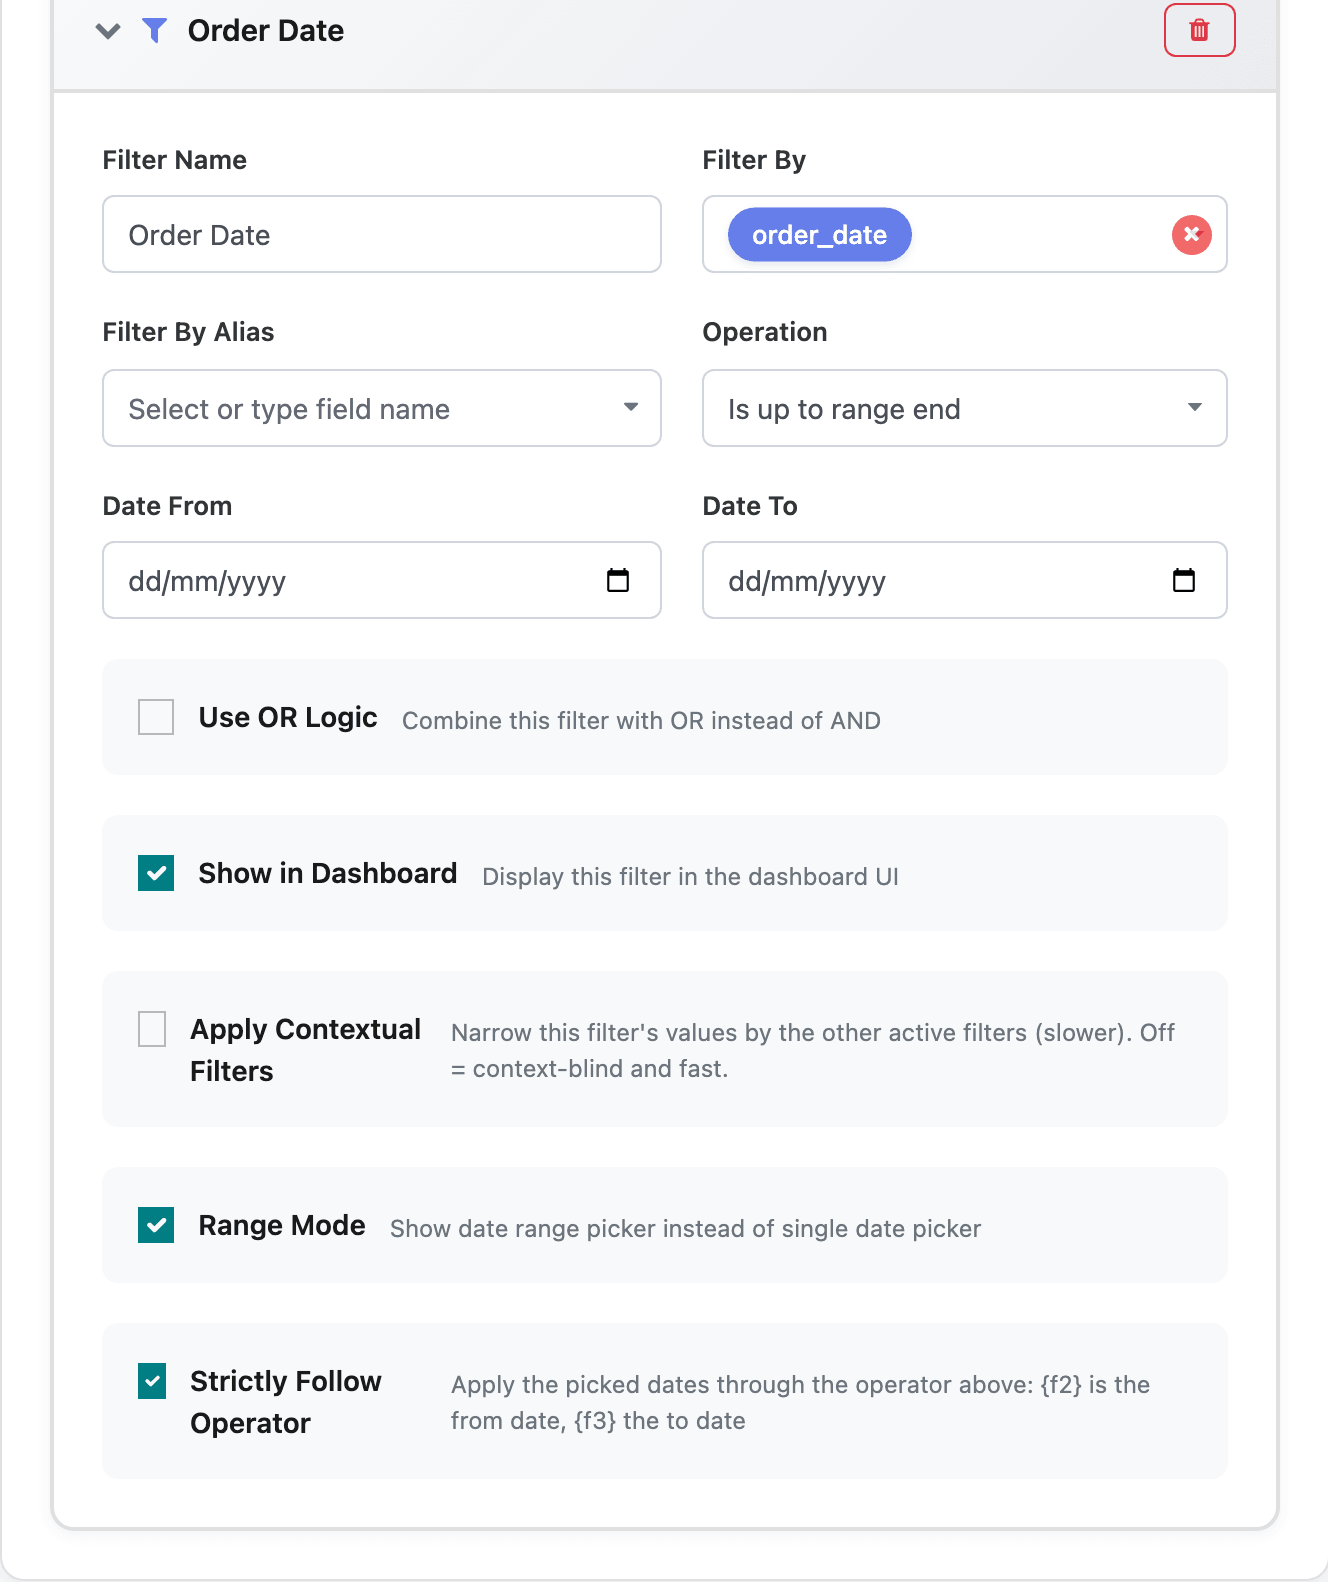
Strictly Follow Operator sends the picked dates through Is up to range end, which keeps every order up to the end of the range. Without it, a picked range becomes a plain “between” and the previous period disappears.
2. Find the filter’s key
Section titled “2. Find the filter’s key”Every filter line has a hidden key, such as fkq7m2xa. The columns need it, and the custom field wizard is where it shows.
-
Open the Configuration tab and click Add Column.
-
Click the new column’s Field box and choose Custom….
-
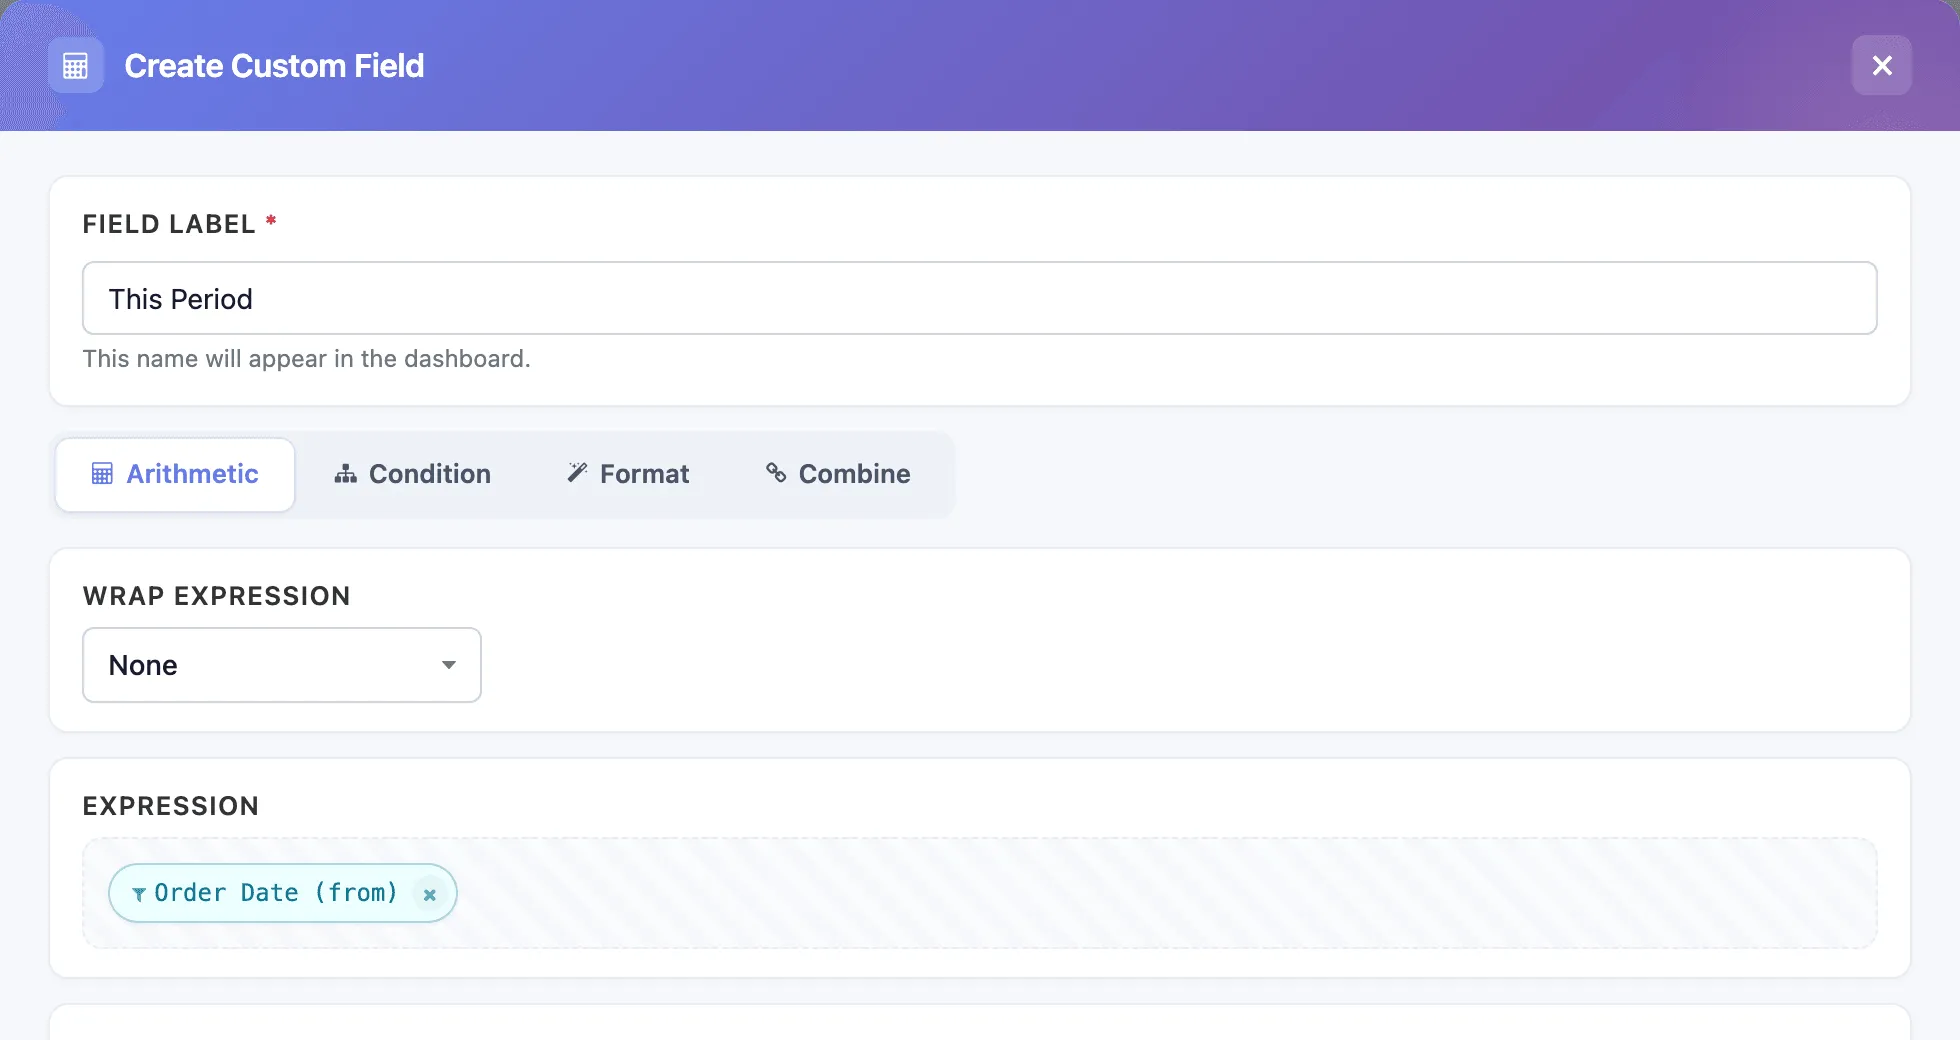
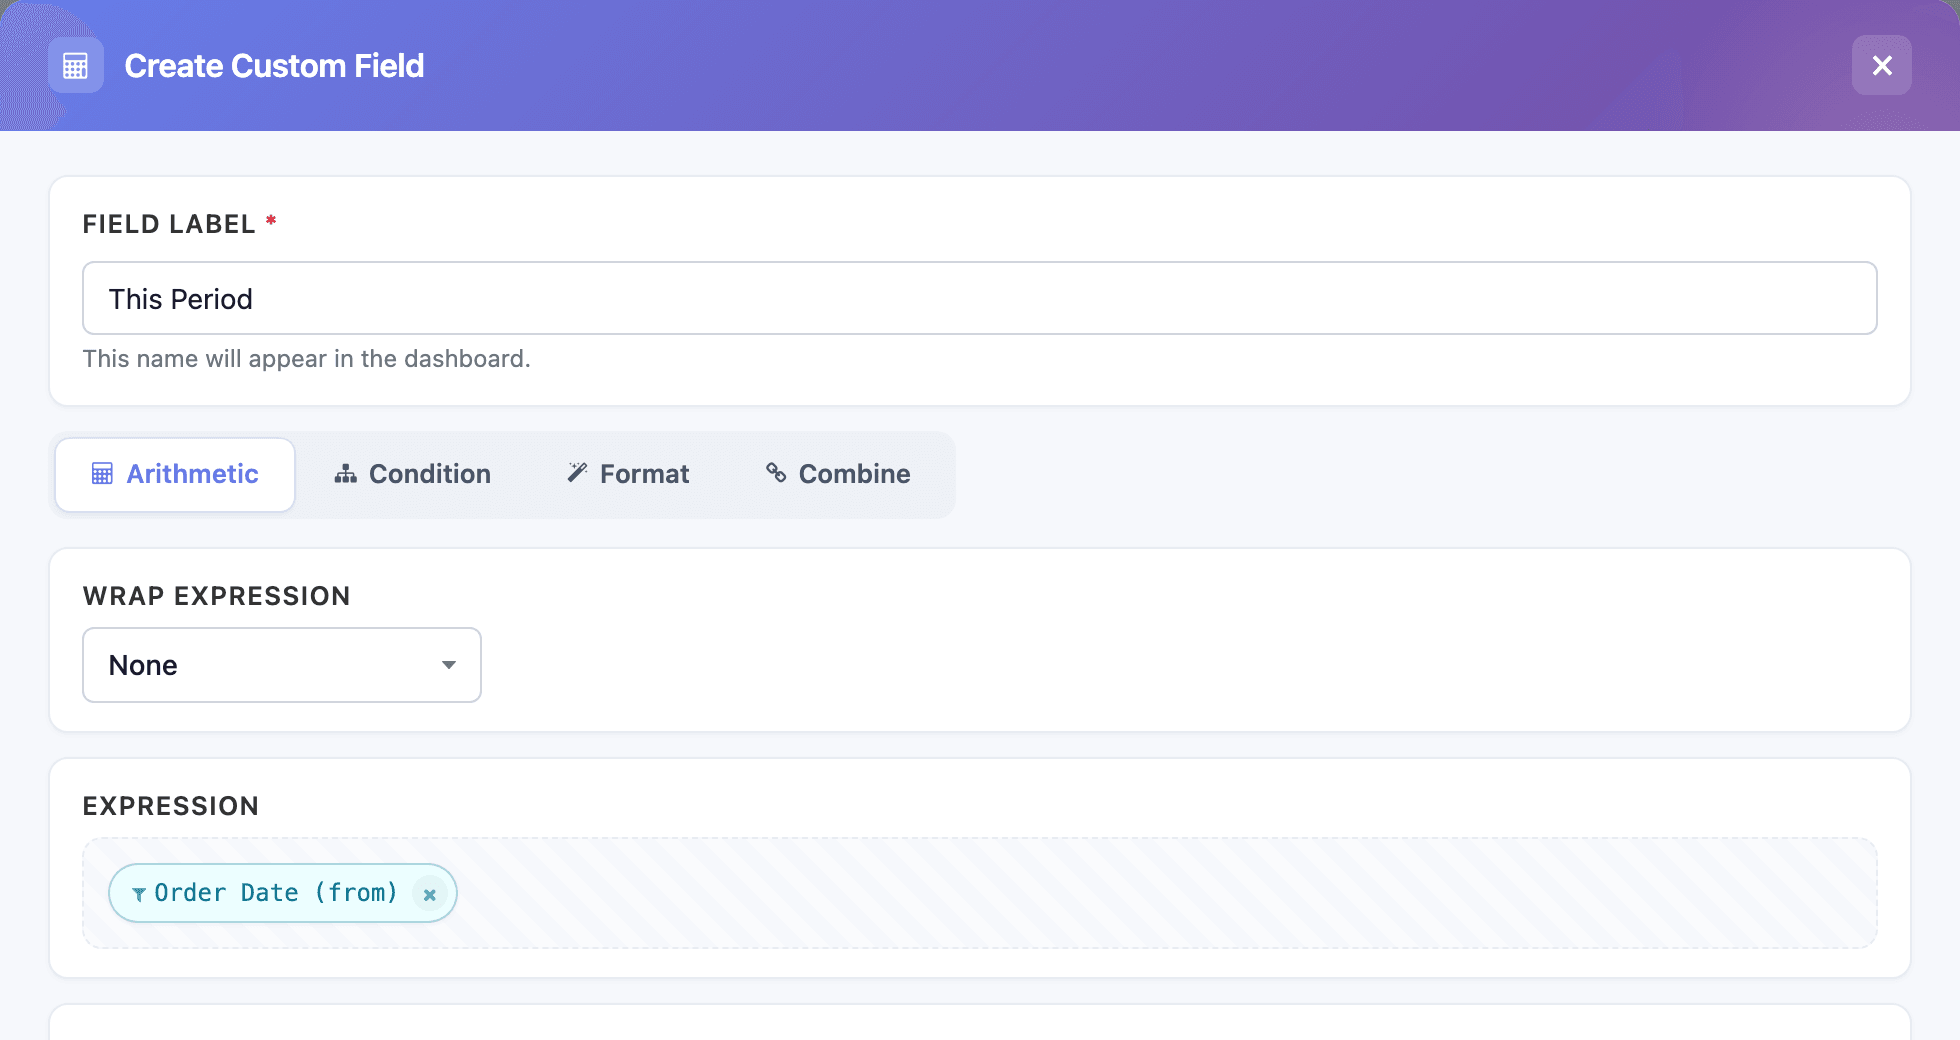
Type This Period as the Field Label. Under Arithmetic, open Date Tools, pick Order Date in Select date filter…, and click + Date from. The token Order Date (from) appears in the expression.
-
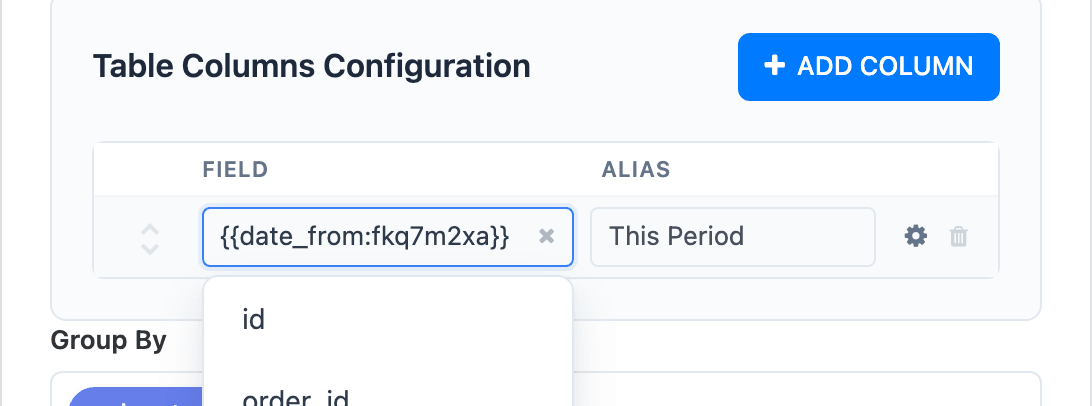
Click Apply, then click into the column’s Field box. It now shows the token as text, with the key:
{{date_from:fkq7m2xa}}.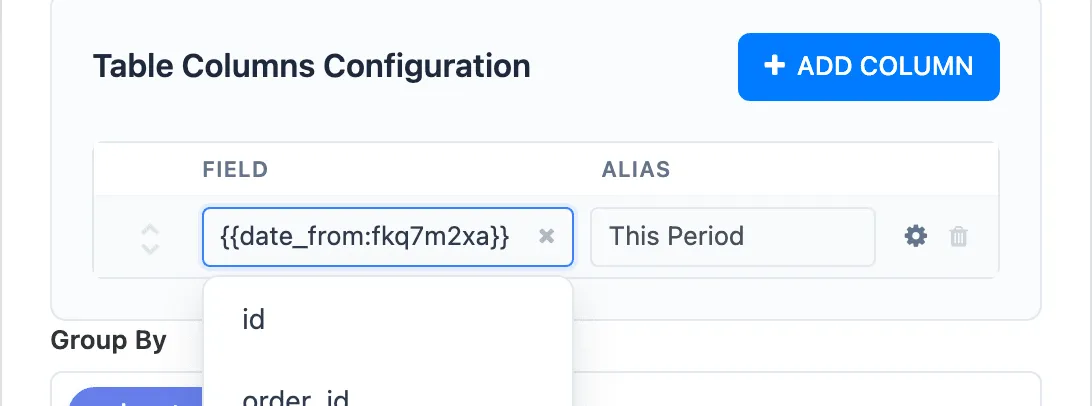
Your key is different. In the expressions below, replace fkq7m2xa with yours.
3. Add the columns
Section titled “3. Add the columns”With the cursor still in the Field box, replace the token with the full expression for This Period and press Enter. Add the other columns the same way: Add Column, type the expression in Field, press Enter, and type the header in Alias.
| Alias | Field |
|---|---|
| Sales Team | sales_team |
| This Period | SUM(CASE WHEN order_date >= {{date_from:fkq7m2xa}} THEN untaxed_amount ELSE 0 END) |
| Previous Period | see below |
| Change % | see below |
Previous Period:
CASE WHEN isfinite({{date_from:fkq7m2xa}}) AND isfinite({{date_to:fkq7m2xa}})THEN SUM(CASE WHEN order_date >= {{date_from:fkq7m2xa}} - ({{date_to:fkq7m2xa}} - {{date_from:fkq7m2xa}} + 1) AND order_date < {{date_from:fkq7m2xa}} THEN untaxed_amount ELSE 0 END)ENDChange % repeats both sums, because a column can’t refer to another column:
CASE WHEN isfinite({{date_from:fkq7m2xa}}) AND isfinite({{date_to:fkq7m2xa}})THEN 100.0 * (SUM(CASE WHEN order_date >= {{date_from:fkq7m2xa}} THEN untaxed_amount ELSE 0 END) - SUM(CASE WHEN order_date >= {{date_from:fkq7m2xa}} - ({{date_to:fkq7m2xa}} - {{date_from:fkq7m2xa}} + 1) AND order_date < {{date_from:fkq7m2xa}} THEN untaxed_amount ELSE 0 END)) / NULLIF(SUM(CASE WHEN order_date >= {{date_from:fkq7m2xa}} - ({{date_to:fkq7m2xa}} - {{date_from:fkq7m2xa}} + 1) AND order_date < {{date_from:fkq7m2xa}} THEN untaxed_amount ELSE 0 END), 0)ENDYou can paste each expression on one line; the line breaks are only for reading.
Then finish the table:
-
Set Group By to sales_team and Order By to sales_team.
-
Open each money column’s gear (Column settings). On Format, choose Number with 0 Decimal places, and type — in Show for empty values.
-
For Change %, choose Percentage with 1 decimal place and untick Multiply by 100 (0.25 → 25%), since the expression already multiplies by 100. On Rules, add Number >
0in green and Number <0in red. On Aggregation, set the totals row to None (leave blank): a sum of percentages means nothing. -
Under Advanced, tick Show Totals, then click Save & Preview.
-
Open Dashboard Settings (the cog in the top bar), tick Enable Global Date Range Filter, and save.
On the dashboard, pick a range in the Date Filter (or on the table’s own Order Date chip). With Last 30 Days on 8 October 2026, This Period covers 9 September to 8 October and Previous Period covers 10 August to 8 September.
Why it works
Section titled “Why it works”- The filter line keeps every confirmed line up to the end of the picked range, so the earlier rows are still there for the Previous Period column.
{{date_to:…}} - {{date_from:…}} + 1is the number of days picked. Going back that many days from the start date gives the start of the previous period.- Until someone picks dates, the tokens stand for “the beginning of time” and “the end of time”. Date arithmetic on those fails, so the
isfinite(...)check leaves Previous Period and Change % empty instead. This Period then shows all history. - The table’s numbers aren’t rounded the way tile values are, and the Number format with 0 decimals only changes how they display.
The This Period total (809,179) matches a Net Sales tile filtered on the same 30 days, which is a quick way to check your expressions.
Variations
Section titled “Variations”Same period last year. Replace the previous-period condition in both columns with:
order_date >= {{date_from:fkq7m2xa}} - INTERVAL '1 year'AND order_date < {{date_to:fkq7m2xa}} + 1 - INTERVAL '1 year'A single figure. Leave out the Sales Team column and Group By, and the table has one row. Under Advanced, Transpose table turns it into a vertical card.
Other measures. Swap untaxed_amount for any numeric column, or COUNT(DISTINCT order_id)-style counts written as COUNT(DISTINCT CASE WHEN order_date >= {{date_from:fkq7m2xa}} THEN order_id END).
Related: Date filters, Custom fields, Totals and % of group.