

Introduction
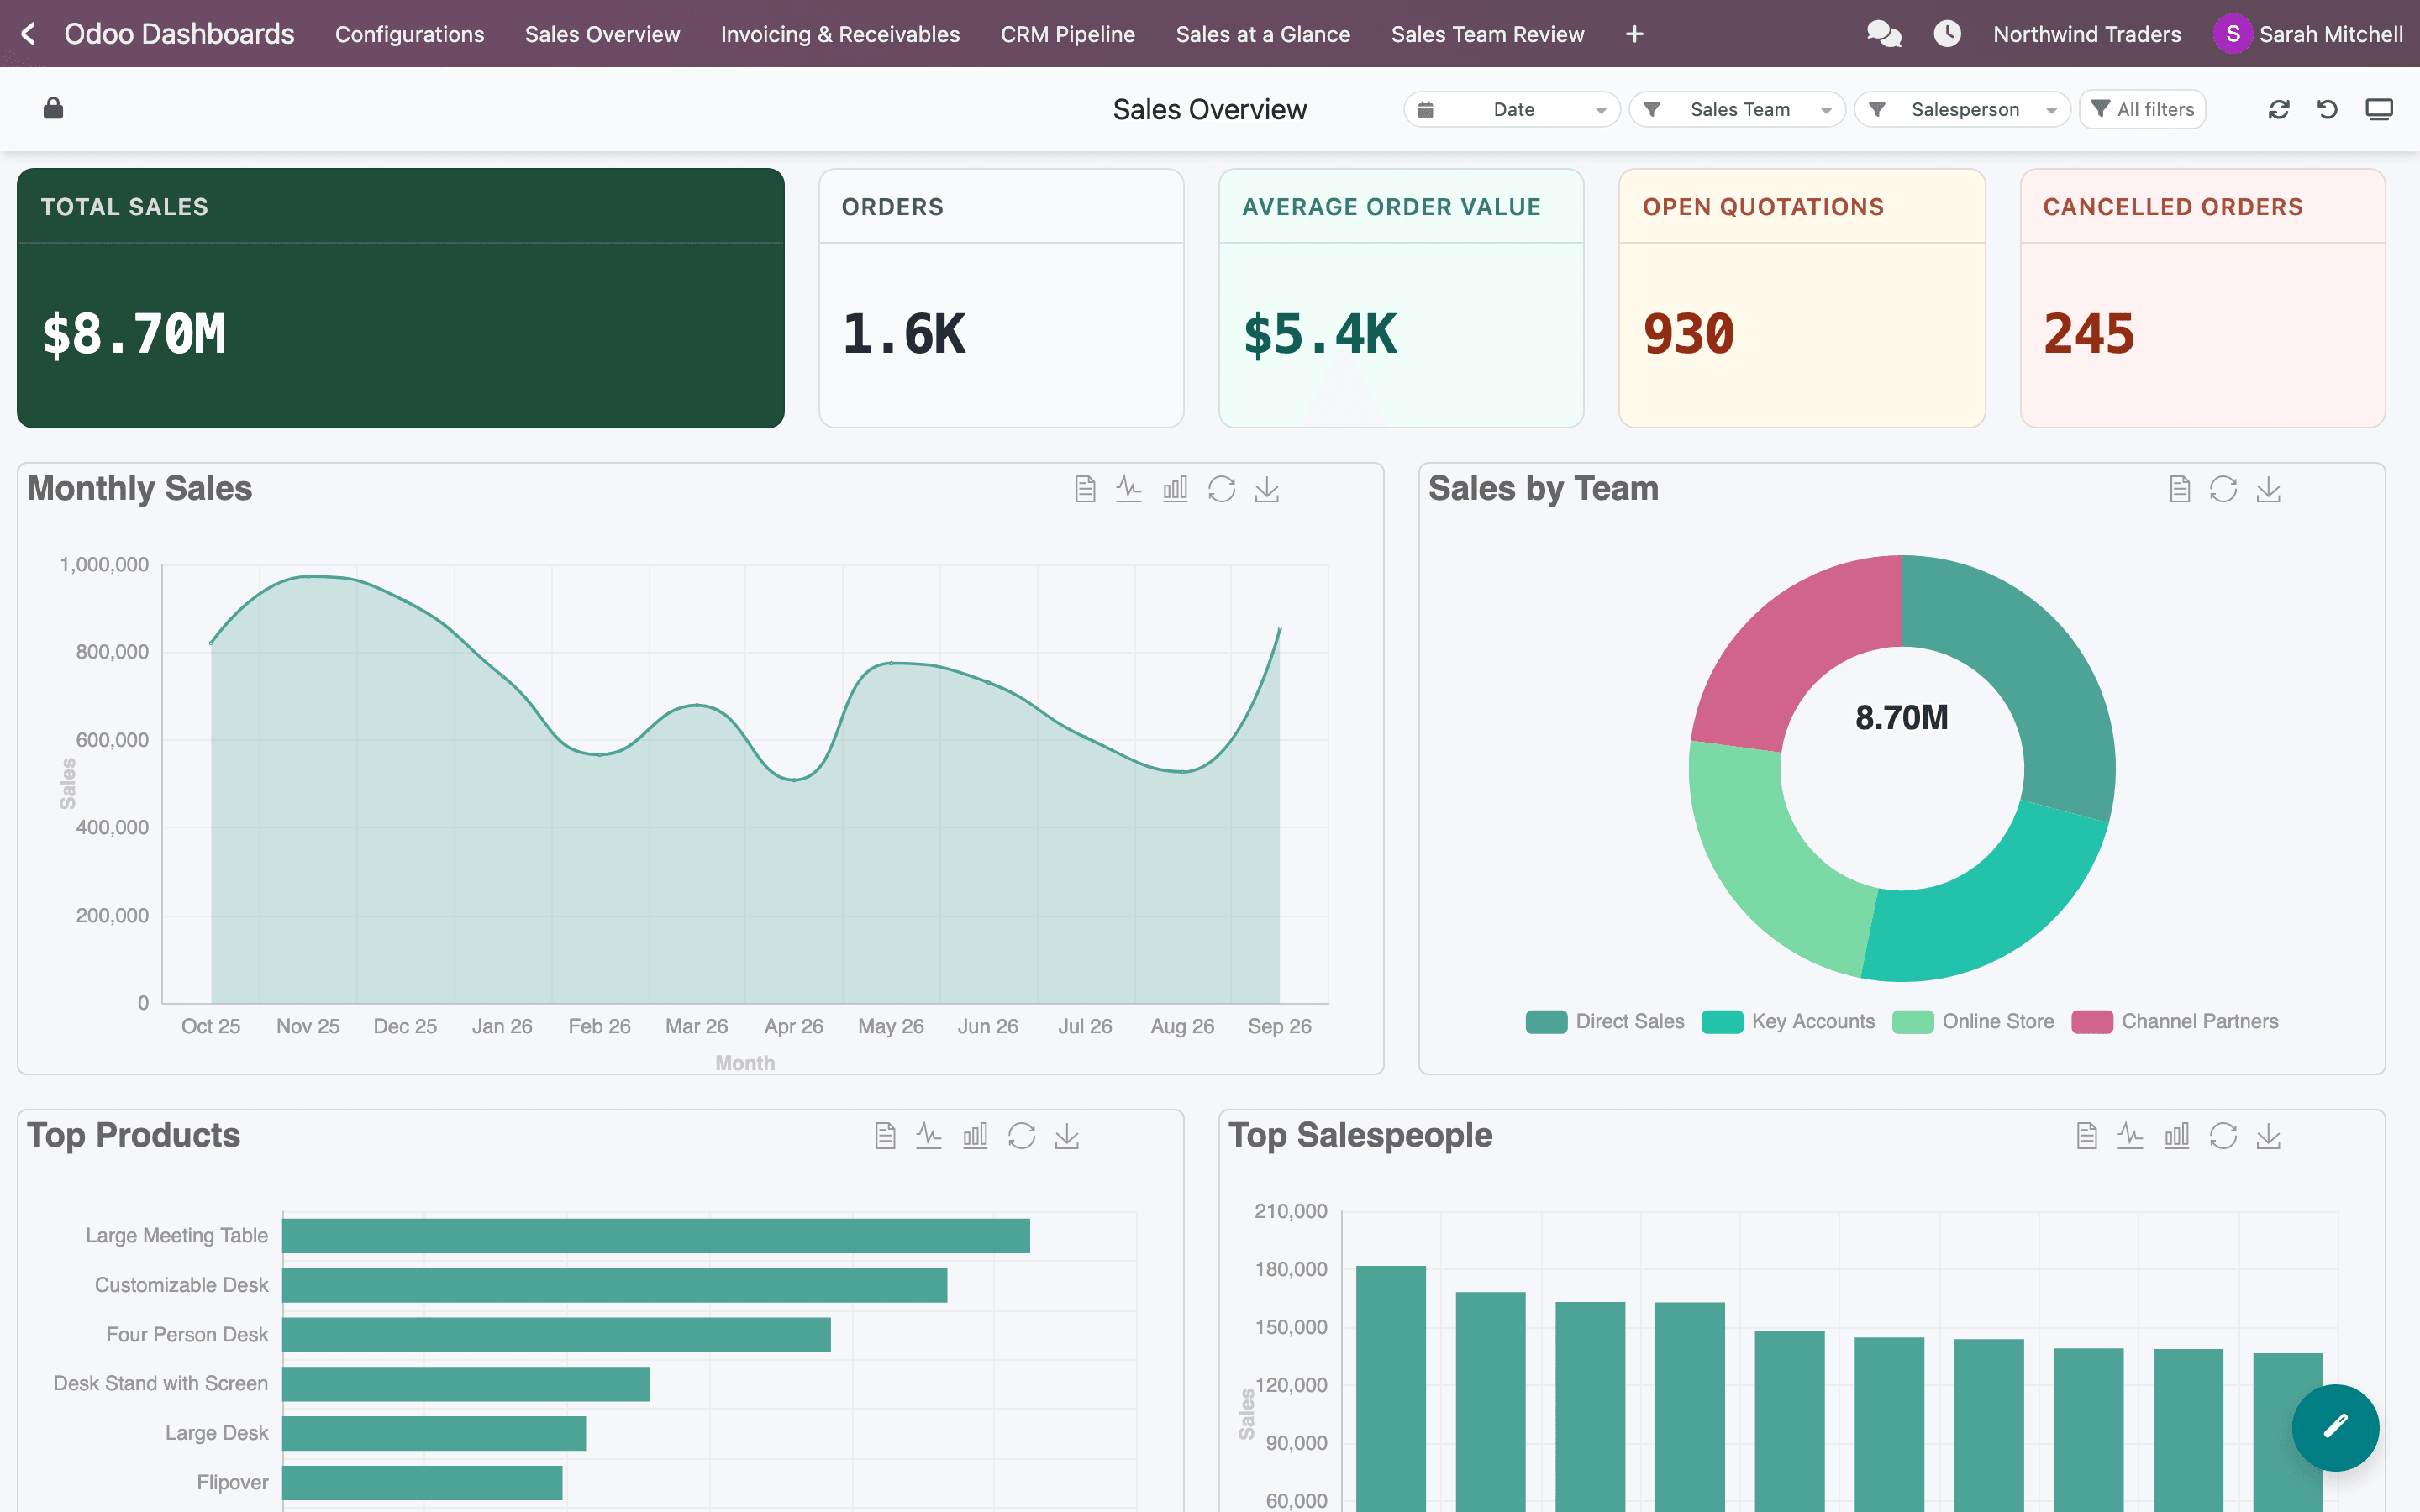
Odoo Dashboards is an Odoo app for building dashboards on your live Odoo data. You pick the data, choose how to show it (a KPI tile, a chart, a table, a pivot, a heatmap or a map), and arrange the widgets on a grid. Everyone you share the dashboard with sees up-to-date numbers inside Odoo, with filters they can change themselves.
There is no external BI tool to connect, no data export and no code. Dashboards are built in the browser with the Dashboard Builder, and they open from the Odoo menu like any other app.
Who it is for
Section titled “Who it is for”- Managers and owners who want the numbers that matter on one screen, without asking for a report every week.
- Functional consultants and power users who build dashboards for their team or their clients. Most of these docs are written for you.
- Odoo partners and developers who need custom SQL, joins across models, or dashboards opened from any Odoo record.
About the screenshots
Section titled “About the screenshots”The screenshots in these docs are taken on Odoo 16 Enterprise with demo data for a company called Northwind Traders. On Odoo Community, or on a newer Odoo version, Odoo’s own menus and colours look a little different, but the app’s screens are the same.
How these docs are organised
Section titled “How these docs are organised”The docs go from the basics to advanced topics. If you are new, read the Getting started pages in order.
Your data stays in your Odoo
Section titled “Your data stays in your Odoo”Dashboards read straight from your Odoo database, so the numbers are always current. To build each query, the app sends a description of it to the Odoo Dashboards service: which view and columns to read, how to aggregate them, and the filter values you picked. The service sends back the SQL, and the SQL runs on your own server. Your records are not sent anywhere.