

Pivot table
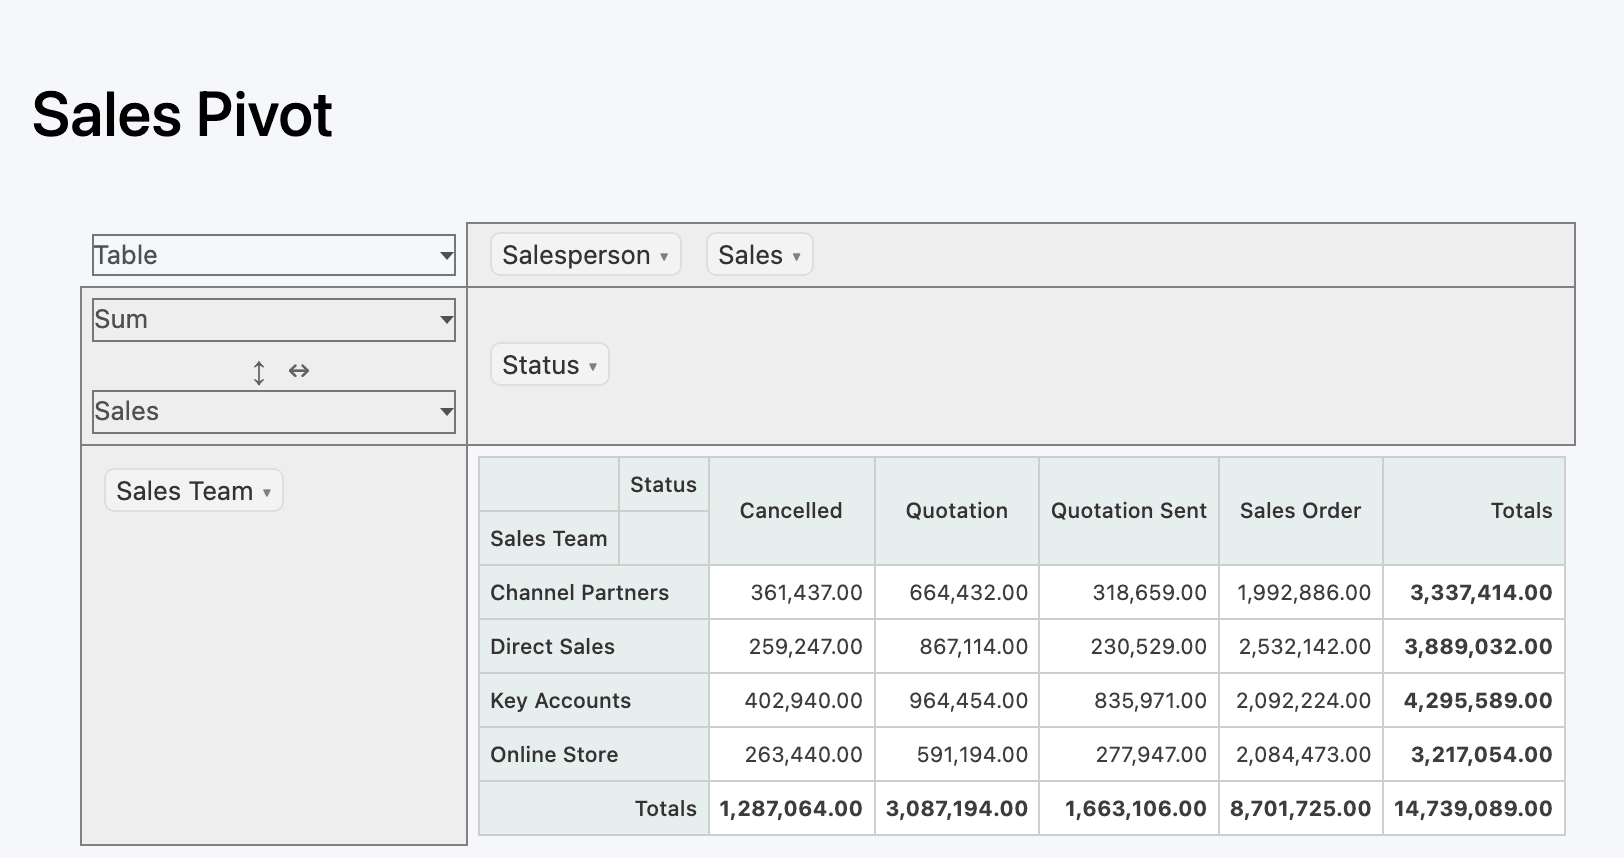
The Pivot Table is an interactive pivot that runs in the browser. Viewers drag fields between rows and columns, change the calculation and switch to a heatmap or bar view, all on their own screen.
Pivot table or Matrix Report?
Section titled “Pivot table or Matrix Report?”Both show rows by columns. They work differently:
| Pivot Table | Matrix Report | |
|---|---|---|
| Where it calculates | In the browser, from the rows the widget loads | On the server, in SQL |
| Viewers can re-pivot | Yes, freely, by dragging | They can change the column field and grain |
| Number formats, totals, conditional colours, export | Basic | Full table features |
| Date columns by month or quarter | Only if the dataset already has a month column | Built in (Column Grain) |
| Large data | Slows down: every row is sent to the browser | Fine |
The Pivot Table is the older of the two. For new reports, use the Matrix Report, and keep the Pivot Table for small datasets where viewers want to explore freely.
Set one up
Section titled “Set one up”A pivot table has two halves: columns that load the data, like a table, and the pivot’s starting layout.
-
Click New Item, choose Pivot Table and a dataset.
-
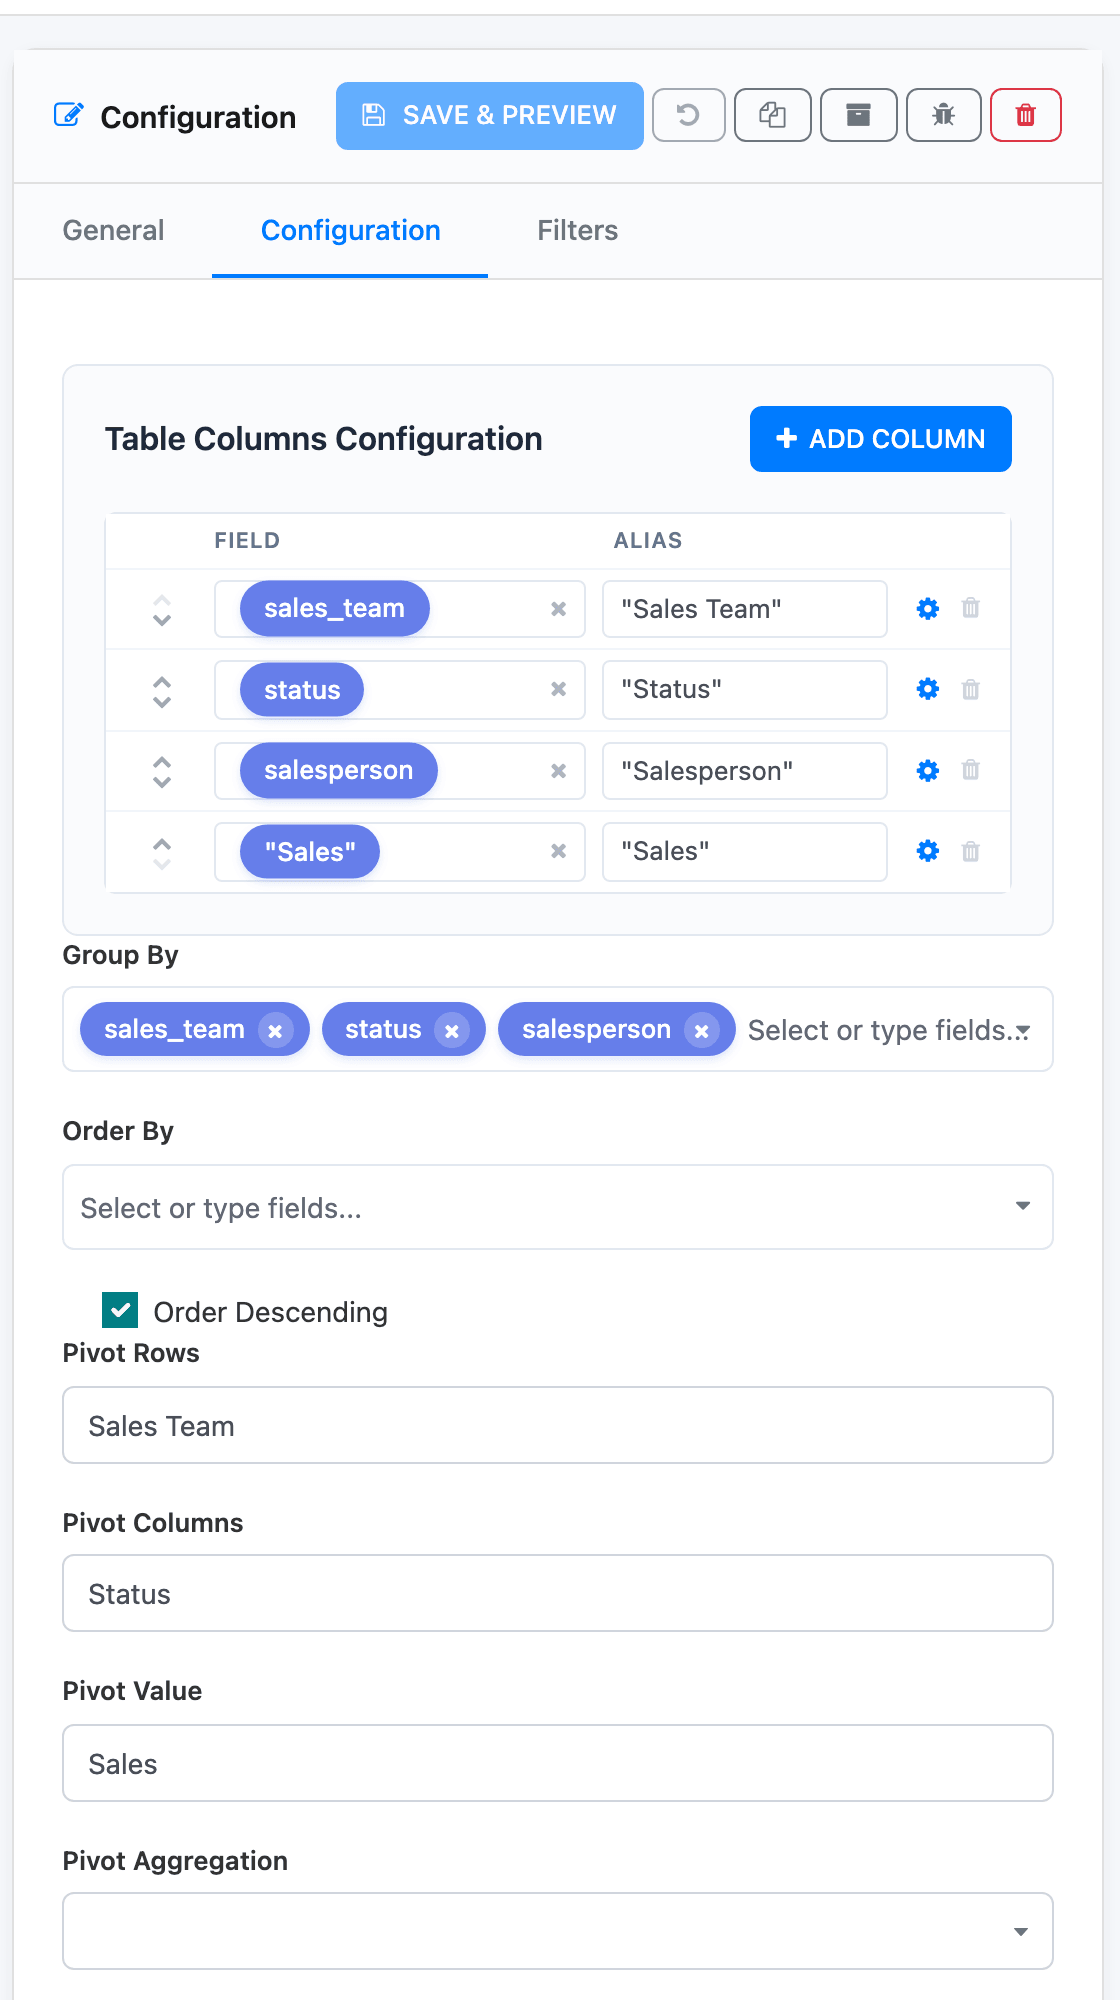
Under Table Columns Configuration, click Add Column for each field the pivot needs: the fields for rows and columns, and the value to add up. Give each an Alias; the pivot uses these names.
-
If a column is summarised, such as
SUM(untaxed_amount), put the other columns in Group By so the data arrives already grouped. That keeps the number of rows small. -
In Pivot Rows, type the alias of the row field, such as
Sales Team. Several fields go comma-separated. -
In Pivot Columns, type the alias of the column field, such as
Status. -
In Pivot Value, type the alias of the number to show, such as
Sales. -
Click Save & Preview.
Using the pivot on the dashboard
Section titled “Using the pivot on the dashboard”- Drag a field name between the row area (left), the column area (top) and the unused fields to re-pivot.
- The first menu switches the view: Table, Table Barchart, Heatmap, Row Heatmap, Col Heatmap or TSV Export (tab-separated text to copy into a spreadsheet).
- The second menu changes the calculation, such as Sum, Count or Average, and the one below it picks the field.
- Click the small arrow on a field to show or hide some of its values.
None of this is saved: reloading the dashboard brings back the layout set in the builder.
Pivot tables have no drilldown and no ⓘ icon. They load their library from the internet, so viewers need internet access.