

Column settings
Every table column has its own settings: how its numbers look, the tooltip on its header, whether viewers see it, how it adds up when grouped, and its colours. They all live in one window, Column Settings.
Open the settings
Section titled “Open the settings”-
In the Dashboard Builder, select the table and open the Configuration tab.
-
In Table Columns Configuration, click the gear (Column settings) at the end of the column’s row.
-
Change what you need on the five tabs, then click Apply.
-
Click Save & Preview. Apply only closes the window; nothing is stored until you save the item.
The gear is highlighted when the column has a format, a description, a running total, or sorting turned off, so you can see at a glance which columns are set up. Cancel, Esc or a click outside the window throws the changes away.
General: tooltip, visibility and behaviour
Section titled “General: tooltip, visibility and behaviour”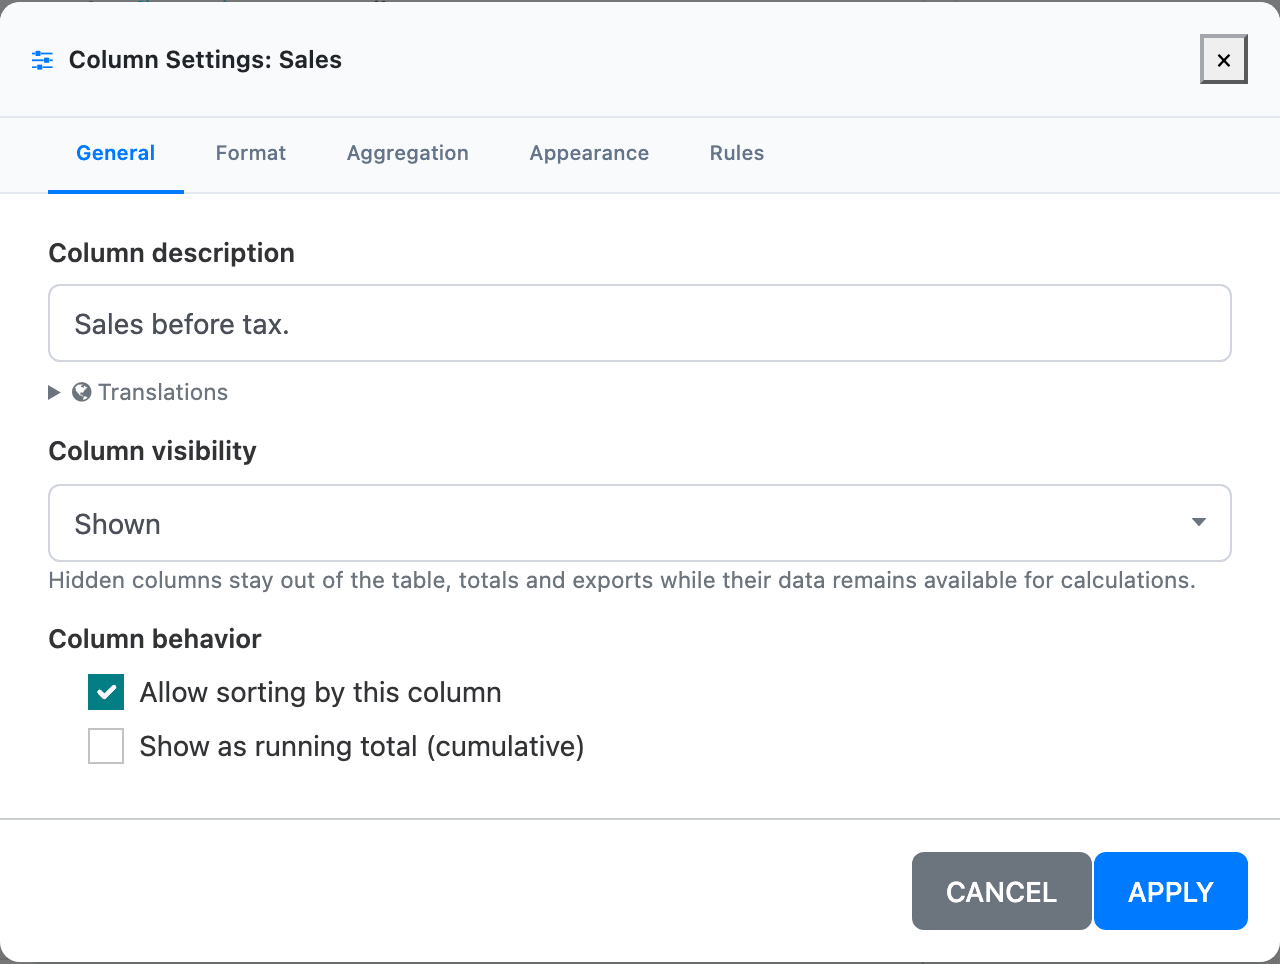
- Column description becomes a tooltip. Viewers see a small ⓘ next to the header and read the text when they hover it. Use it to say exactly what the column counts, for example “Sales before tax.”
- Translations (under the description) holds a Header and a Description per installed language, for dashboards used in several languages.
- Column visibility:
- Shown: the default.
- Hidden by default — viewers can show it from the Columns menu: for detail most people don’t need.
- Always hidden — calculation only, can’t be shown: for a column other parts of the table rely on, such as a value a rule or a share is worked out from. It never appears, and it’s left out of search, totals and exports.
- Column behavior:
- Allow sorting by this column (on by default). Untick it and clicking the header does nothing.
- Show as running total (cumulative) turns each value into the total so far, in the table’s order. With it on, Include opening balance adds a first row, Opening, holding everything before the start of the table’s date filter.
Format: numbers, currency and percentages
Section titled “Format: numbers, currency and percentages”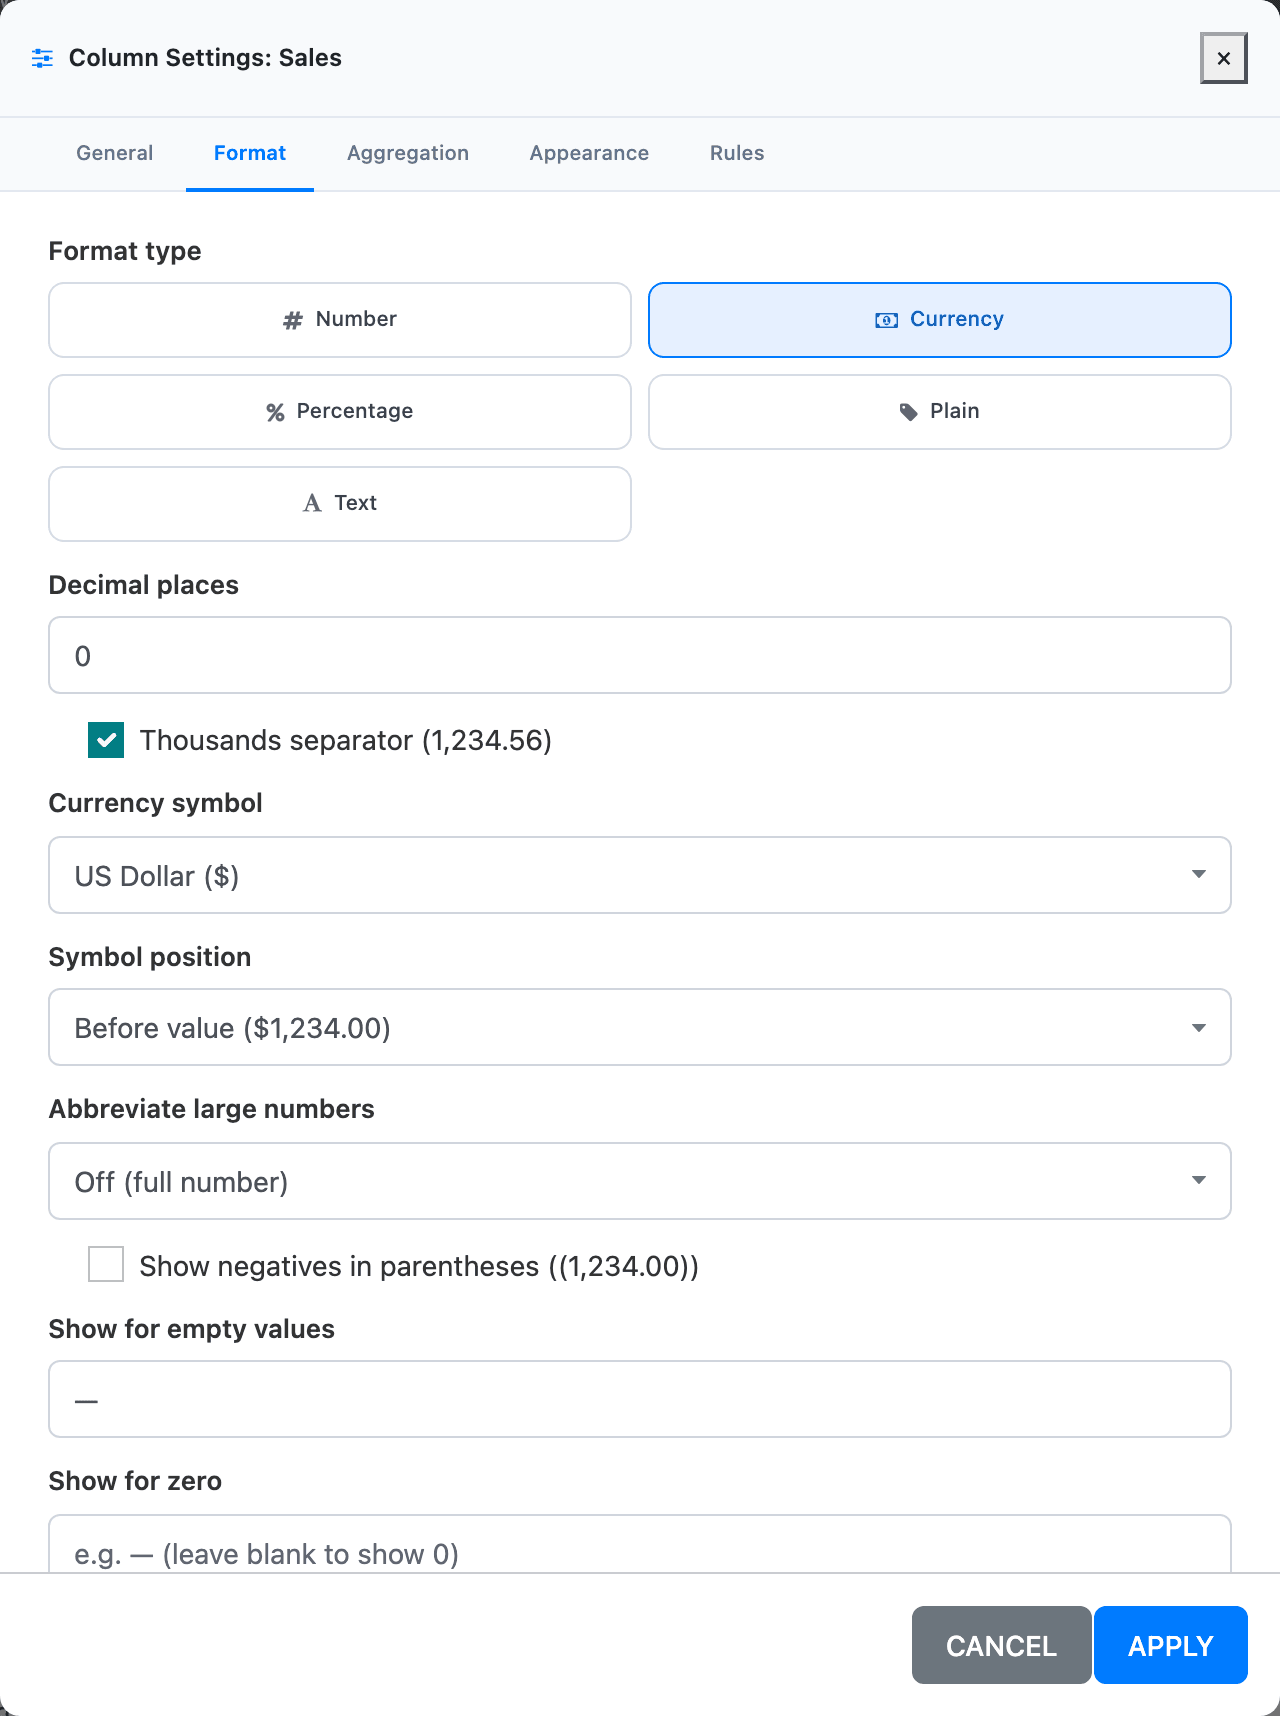
Choose a Format type:
| Format type | Use it for | Example |
|---|---|---|
| Number | Counts, quantities, amounts without a symbol | 1,842 |
| Currency | Money | $1,401,660 |
| Percentage | Shares, rates, growth | 36.5% |
| Plain | IDs, codes and years, shown exactly as stored with no separators | 2026 |
| Text | Values that look like numbers but aren’t, such as postal codes. The column is never added up or formatted. | 00971 |
With no format type, a column keeps the type the table detects: numbers show with 2 decimals and thousands separators, everything else as it comes.
Number, Currency and Percentage share these options:
- Decimal places, from 0 to 10.
- Thousands separator (1,234.56) (Number and Currency).
- Currency symbol (Currency only): Saudi Riyal (SAR), US Dollar ($), Euro (€) or Pound (£), and Symbol position: Before value or After value.
- Multiply by 100 (0.25 → 25%) (Percentage only, on by default). Leave it on when the column holds a ratio such as 0.25. Turn it off when the data already holds 25 for 25%.
- Abbreviate large numbers (not for Percentage): Auto (1.2K, 3.4M, 5.6B), Thousands (K) or Millions (M).
- Show negatives in parentheses ((1,234.00)), the accounting style.
- Show for empty values: text for blank cells, such as a dash. Without it, a blank ratio (a division by zero, say) can show as
0%. - Show for zero: text for cells that are exactly 0.
There is no column width setting either: columns size themselves to their content.
Aggregation: grouped rows and totals
Section titled “Aggregation: grouped rows and totals”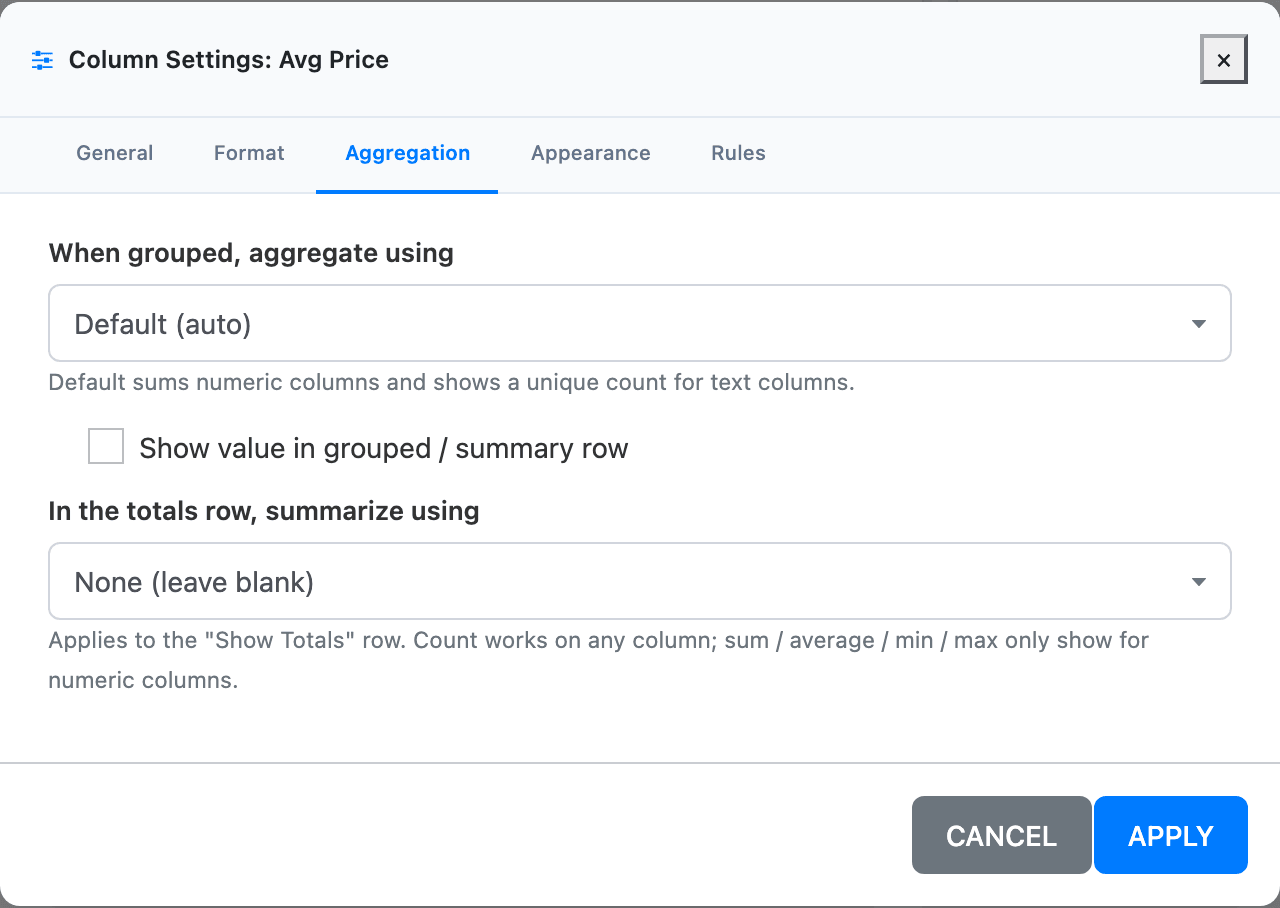
These options decide what the column shows in rows that sum up other rows:
- When grouped, aggregate using: the value on a group row when a viewer groups the table. Default (auto) sums numbers and shows a unique count for text. The other choices are Sum, Count, Unique count, Min, Max and Average.
- Show value in grouped / summary row: untick it to leave the column blank on group rows. Do this for ratios such as an average price, where adding up the rows gives a meaningless number.
- In the totals row, summarize using: the value in the totals row. See Totals and % of group.
Grouping shows how group rows look.
Appearance: alignment, font and colours
Section titled “Appearance: alignment, font and colours”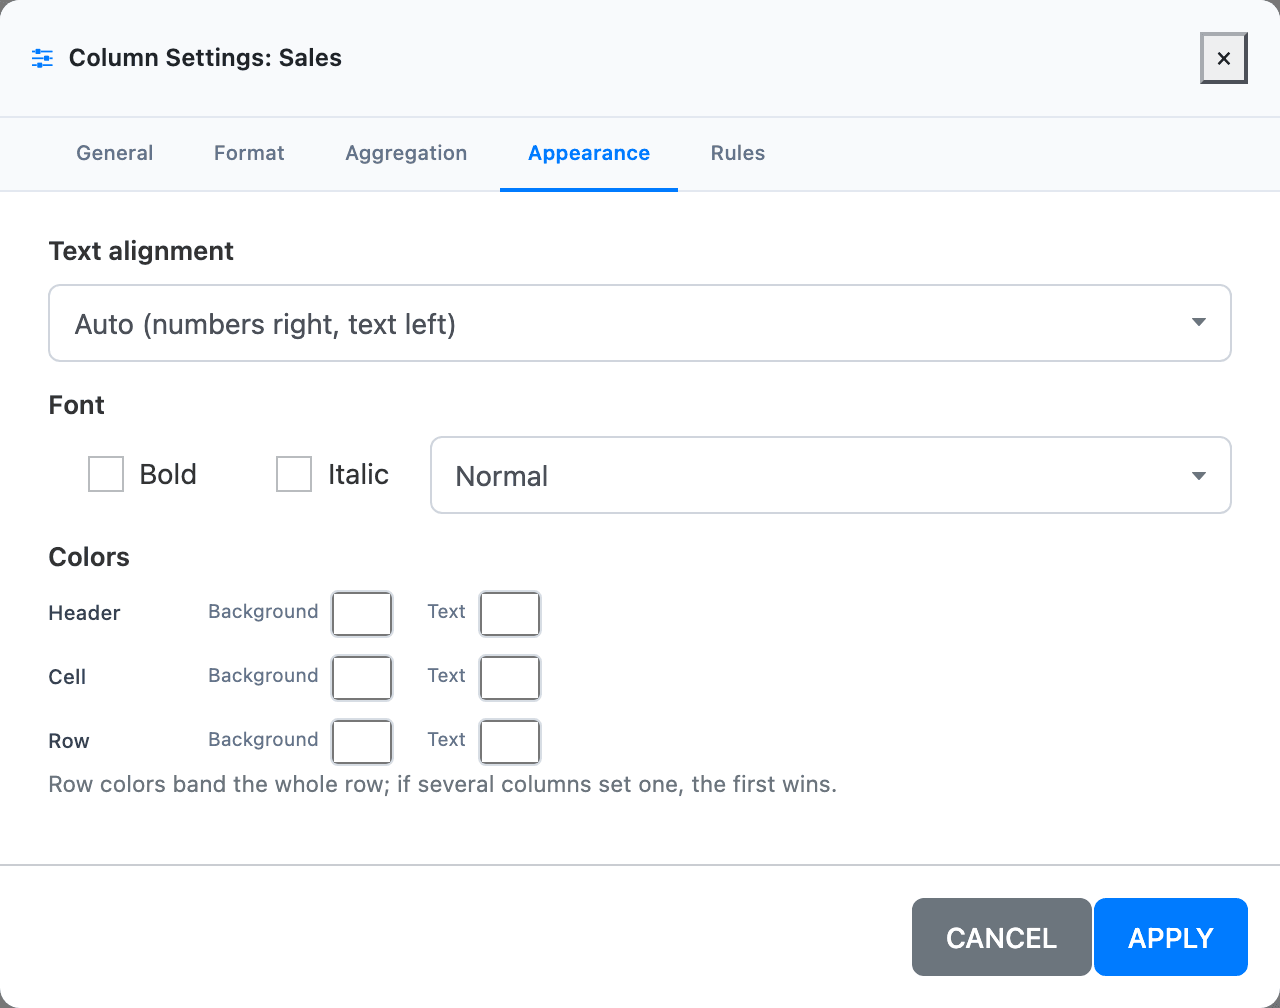
- Text alignment: Auto (numbers right, text left), Left, Center or Right.
- Font: Bold, Italic, and a size of Small, Normal or Large.
- Colors: a background and a text colour for the Header, the column’s Cells, or the whole Row. Each swatch has a × to clear it. If several columns set a row colour, the leftmost wins.
These colours are fixed. To colour cells depending on their value, use the Rules tab: see Conditional formatting.