

Grouping
Grouping folds a long table into a few rows, one per value, that viewers expand when they want the detail. Each group row shows how many rows it holds and the total of each number column.
Tables have two different kinds of grouping, and it helps to keep them apart:
| Group By on the Configuration tab | Group By button on the table | |
|---|---|---|
| Who sets it | The builder | Any viewer (the builder can set a default) |
| What it does | Adds rows up in the database: one table row per group, no way to expand it | Folds the loaded rows into groups that expand and collapse |
| Needed when | A column is summarised (see Build a table) | Never; it’s for reading |
This page is about the second kind.
Group rows in the viewer
Section titled “Group rows in the viewer”-
Click the Group By button (four squares) in the table’s toolbar. The menu is titled Group by column.
-
Tick a column. The rows fold into one group per value.
-
Tick a second column to nest it inside the first. Columns nest in the order you tick them.
-
Click a group row to expand it, and again to collapse it.
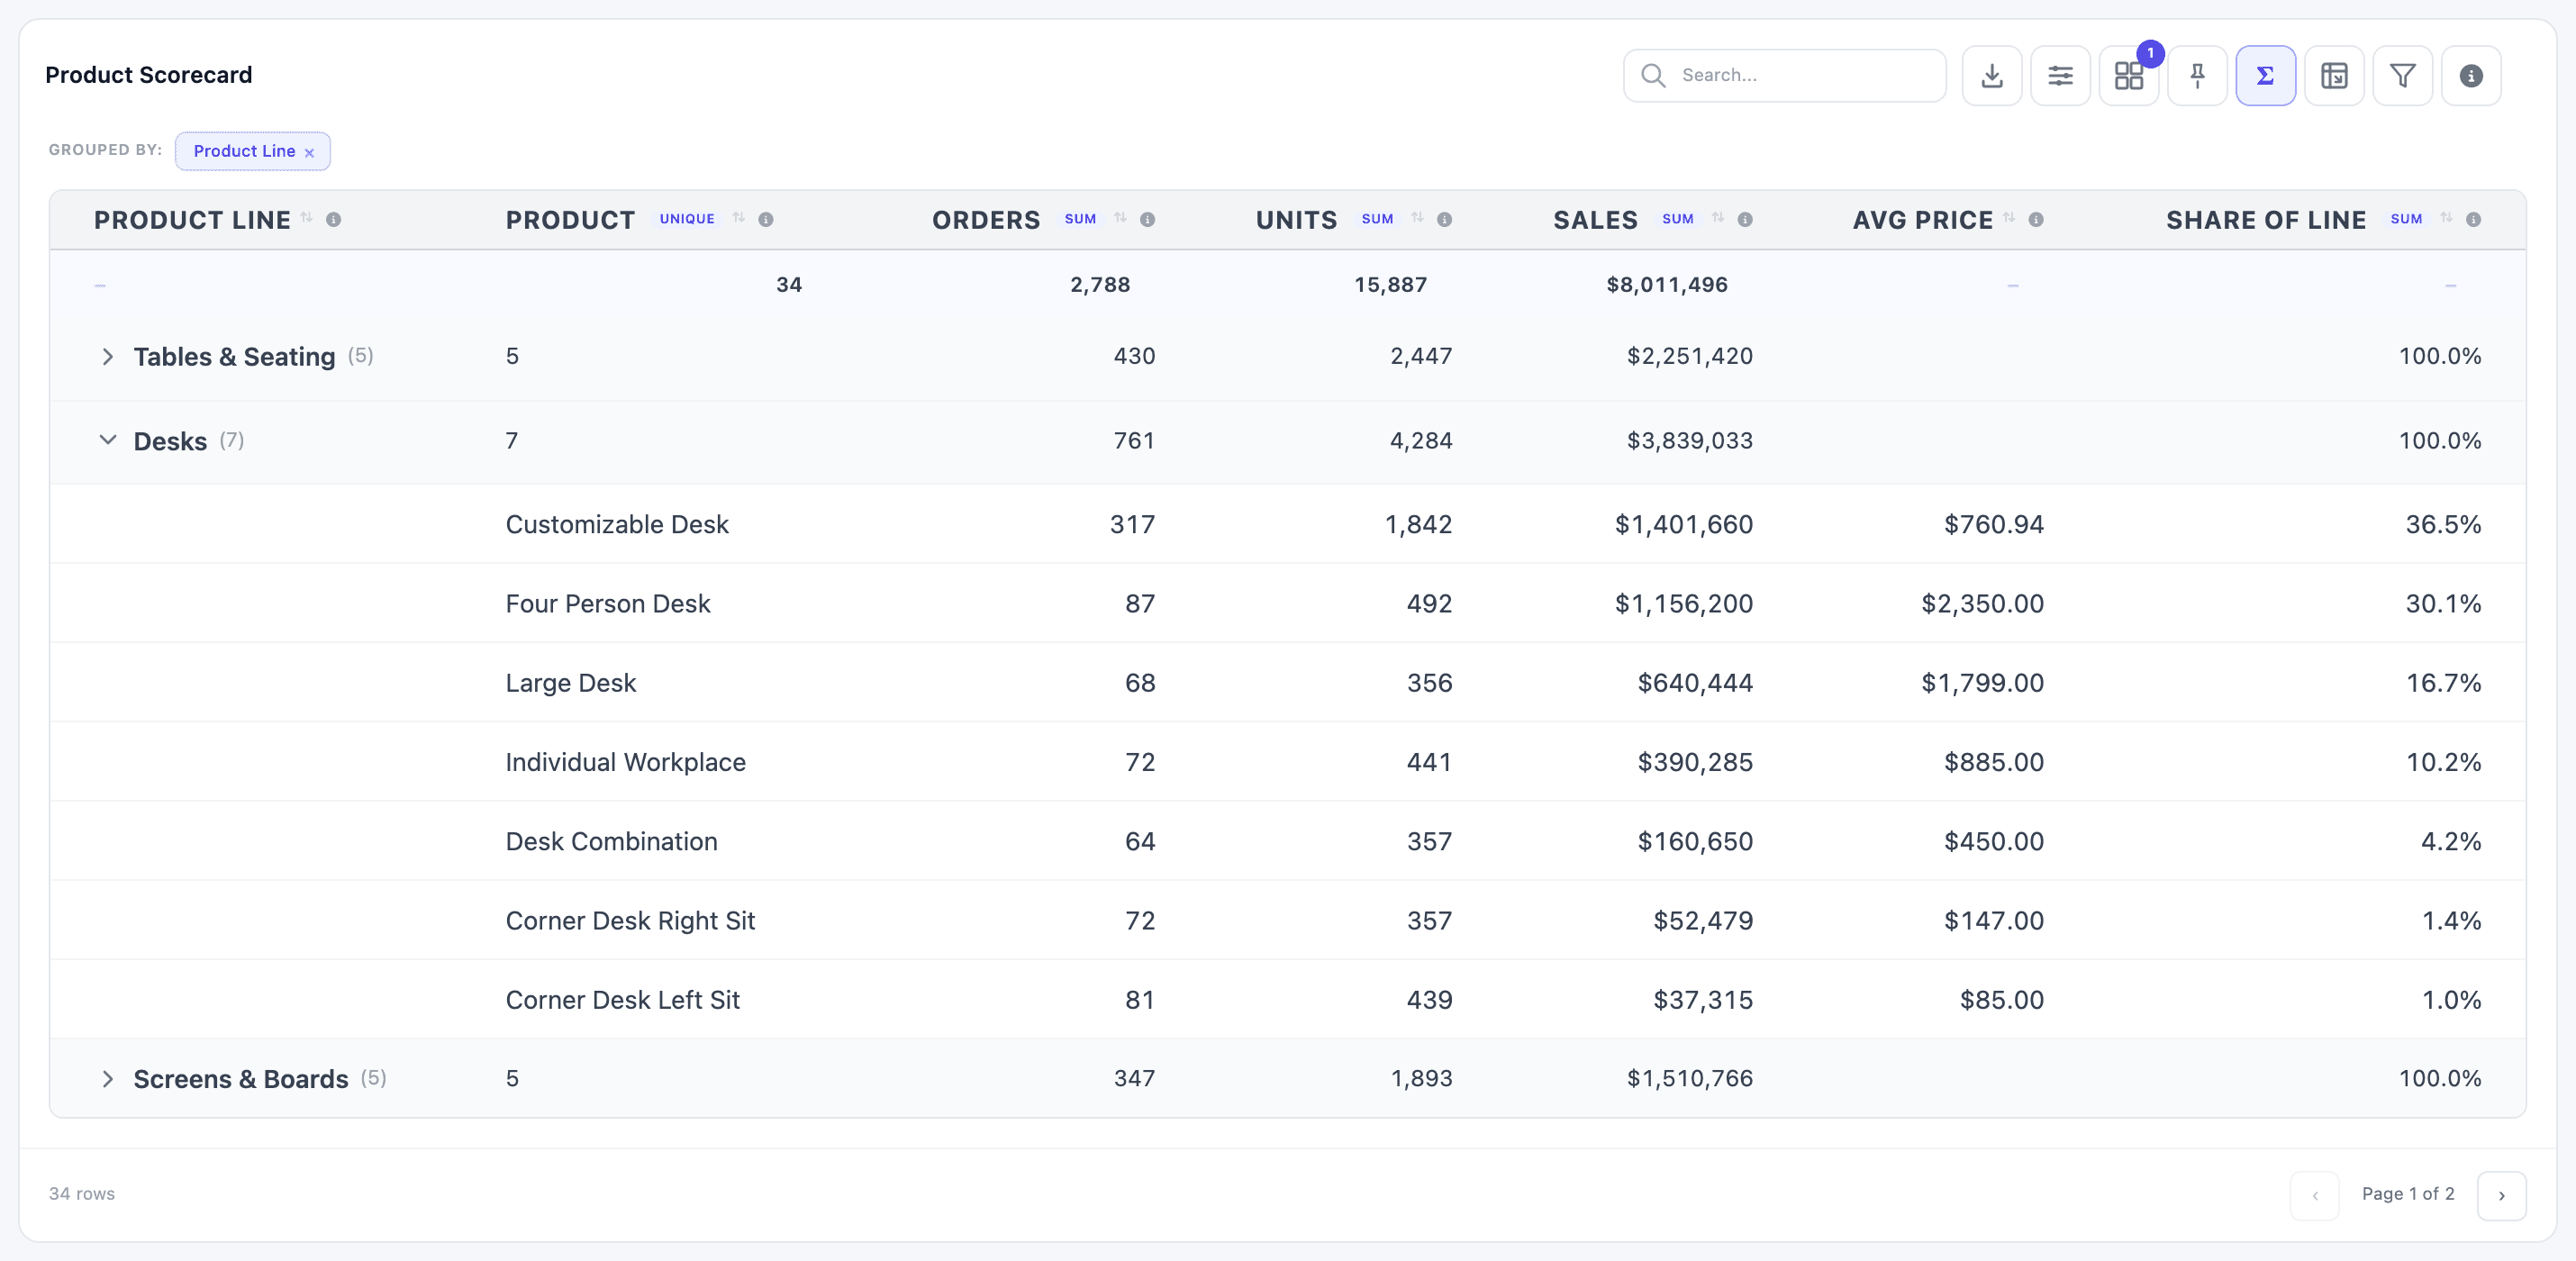
Here Product Scorecard is grouped by Product Line, with Desks expanded:
What you see:
- Each group row has a chevron, the value and the number of rows in it, such as Desks (7). Groups start collapsed.
- The other columns show the group’s total. A small badge in each header says how it’s worked out: SUM, UNIQUE (a count of different values), COUNT, MIN, MAX or AVG. The builder chooses this per column in Column settings.
- Avg Price is blank on group rows because adding up prices means nothing; its Show value in grouped / summary row box is unticked.
- Share of Line adds up to 100.0% on each product line, since every product’s share is of its own line.
- A Grouped by: bar above the table shows one chip per grouping. The × on a chip removes it; Clear all in the menu removes every grouping.
Paging counts the rows you see, group rows included, so expanding a big group can add pages.
There is no expand-all button: open and close groups one at a time.
Group dates by year, month, week
Section titled “Group dates by year, month, week”When you tick a date column, a row of grain boxes appears under it: Year, Quarter, Month, Week and Day.
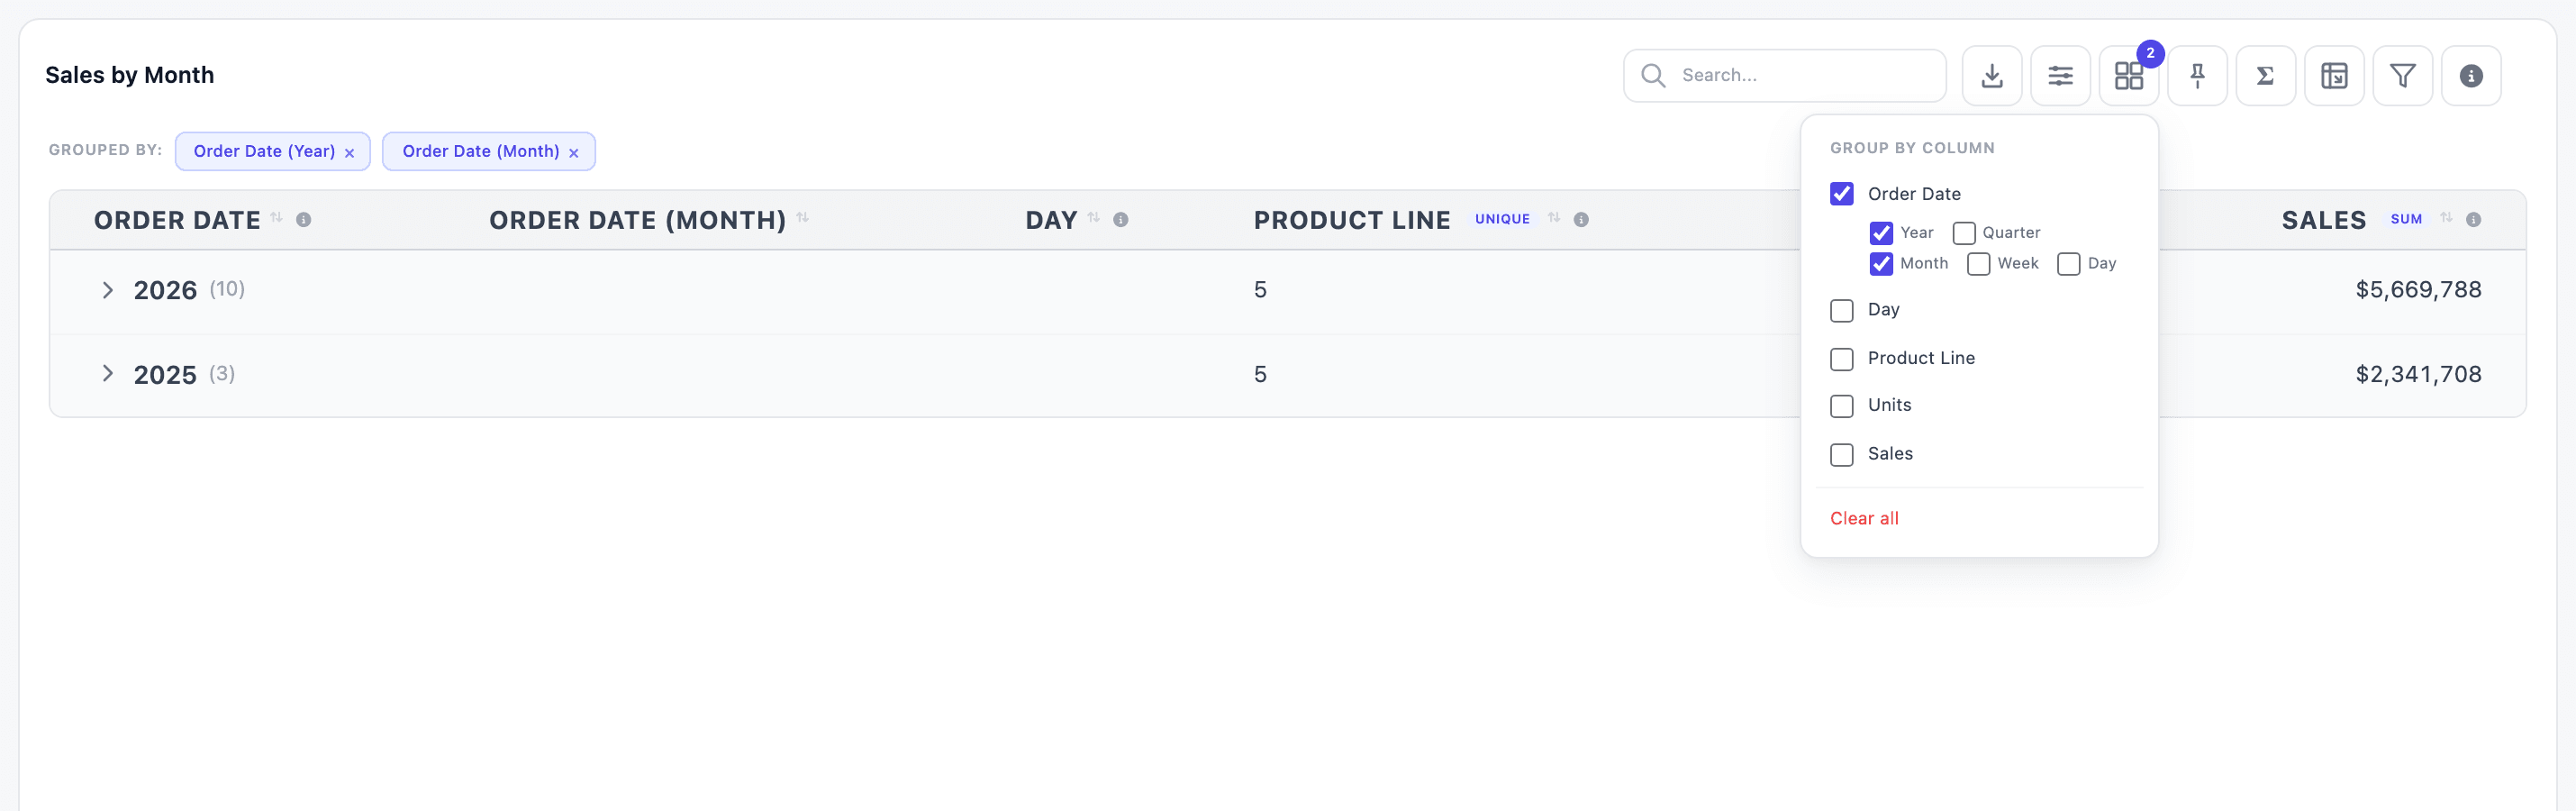
- Tick one grain to group by it, for example Month.
- Tick several to nest them from coarse to fine. Year and Month together give
2026, thenOct 2026inside it. - With no grain ticked, rows are grouped by their exact date.
Each finer grain adds a column to the table, named after the date column, such as Order Date (Month), and gets its own chip in the Grouped by: bar. Removing that chip removes just that grain.
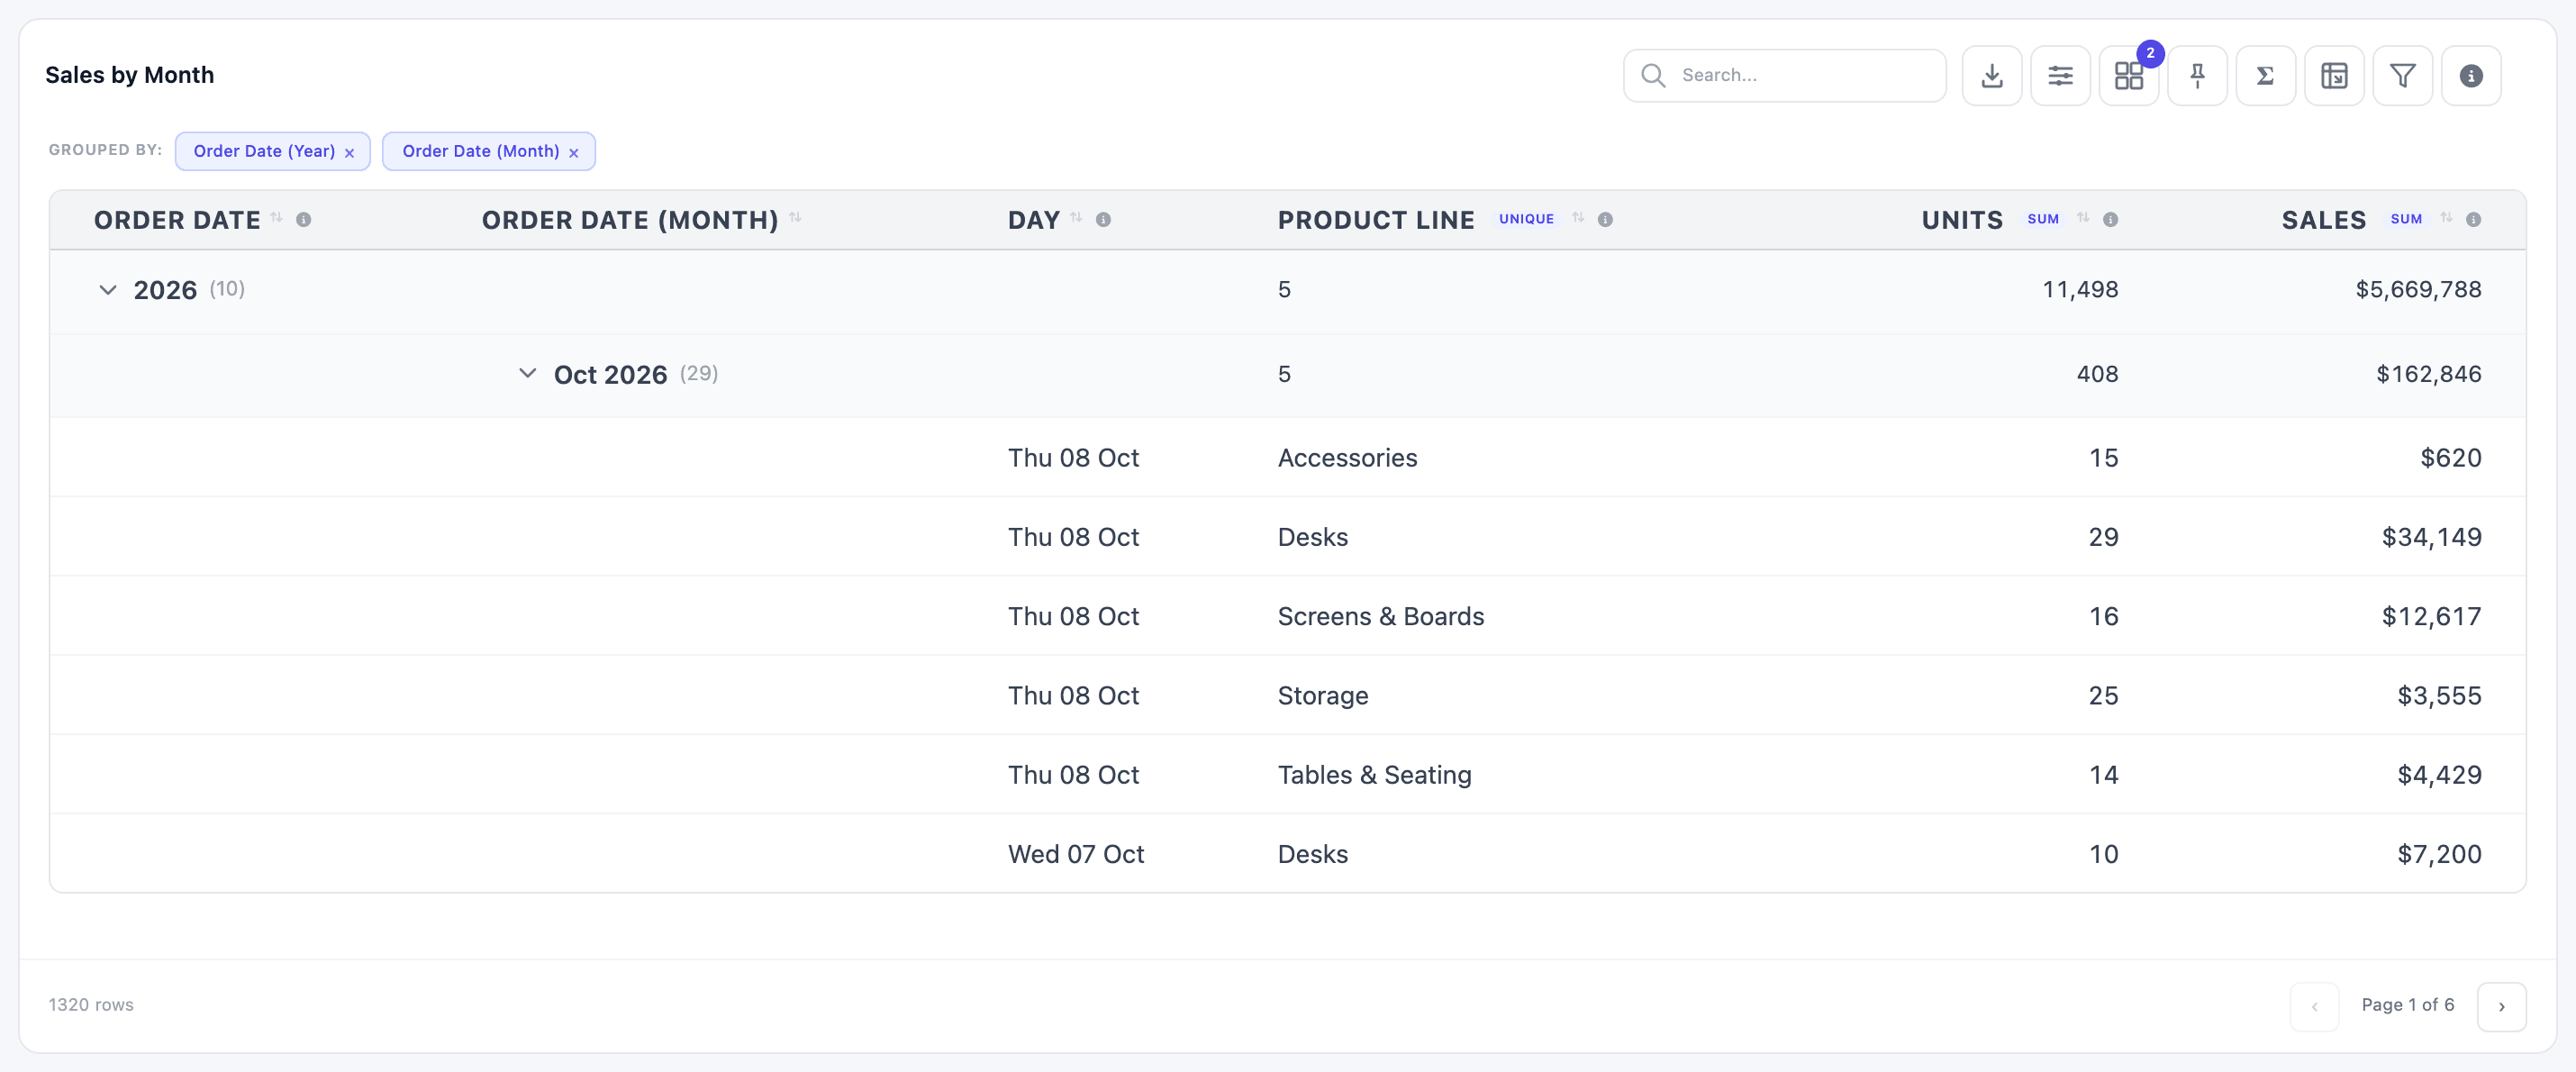
Group labels look like this:
| Grain | Label |
|---|---|
| Year | 2026 |
| Quarter | Q4 2026 |
| Month | Oct 2026 |
| Week | W41 2026 (ISO weeks, Monday to Sunday) |
| Day | Oct 8, 2026 |
Groups appear in the order of the rows underneath them. Sort the table by the date (with Order By in the builder) so months come out in calendar order.
Ship a table already grouped
Section titled “Ship a table already grouped”Viewers’ grouping is theirs alone and resets when the page reloads. To have a table open grouped for everyone:
-
In the Dashboard Builder, select the table, open Configuration and expand Advanced.
-
In Group By (Front-end), pick one or more columns. The list holds the table’s own columns, so set up the columns first.
-
For a date column, tick the grains it should open with, for example Year and Month.
-
Click Save & Preview.
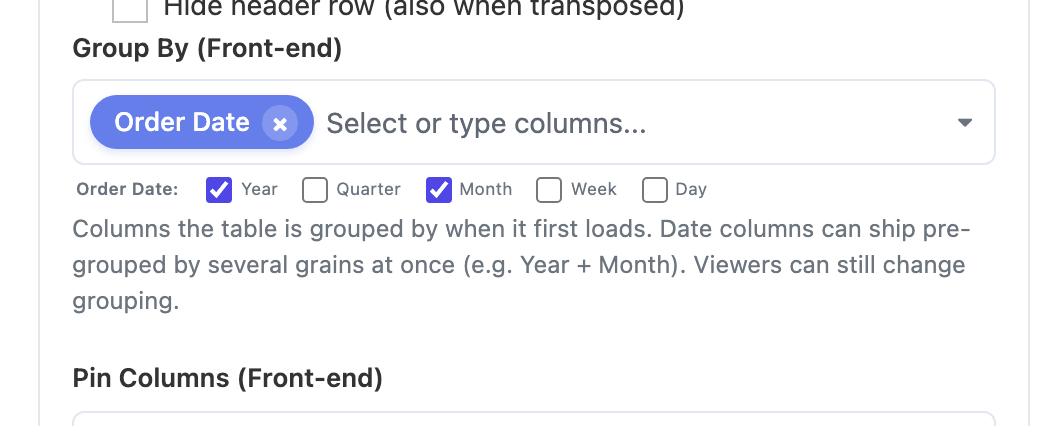
Viewers can still change or remove the grouping. To stop them, tick Hide group by under Toolbar in the same section: the default grouping still applies, but the Group By button and the × on the chips disappear.