

The table toolbar
Every table carries its own toolbar in the top-right corner of the widget. Anyone who can open the dashboard can use it: nothing they do changes the table for other people, and everything resets when the page reloads.

From left to right:
| Control | Tooltip | What it does |
|---|---|---|
| Search box | Search… | Shows only rows containing the text, in any column |
| Download arrow | Export | Downloads the table as CSV or prints it to PDF |
| Sliders | Toggle Columns | Shows and hides columns |
| Four squares | Group By | Folds rows into expandable groups. See Grouping. |
| Pin | Pin Columns | Keeps columns on the left while you scroll sideways |
| Σ | Show Totals | Shows or hides the totals row. See Totals and % of group. |
| Grid with arrow | Transpose | Flips columns into rows |
| Funnel | Column Filters | Adds a filter box under every header |
| ⓘ | The widget’s description | Shows what the table contains and how long it took to load |
A table whose builder set up row actions also gets an Actions button once you select rows. Widget filters, when the table has some, show as chips under the title; they’re covered in Filters.
Everything in the toolbar works on the rows the table loaded from the database, and all of them at once, not just the current page.
Search
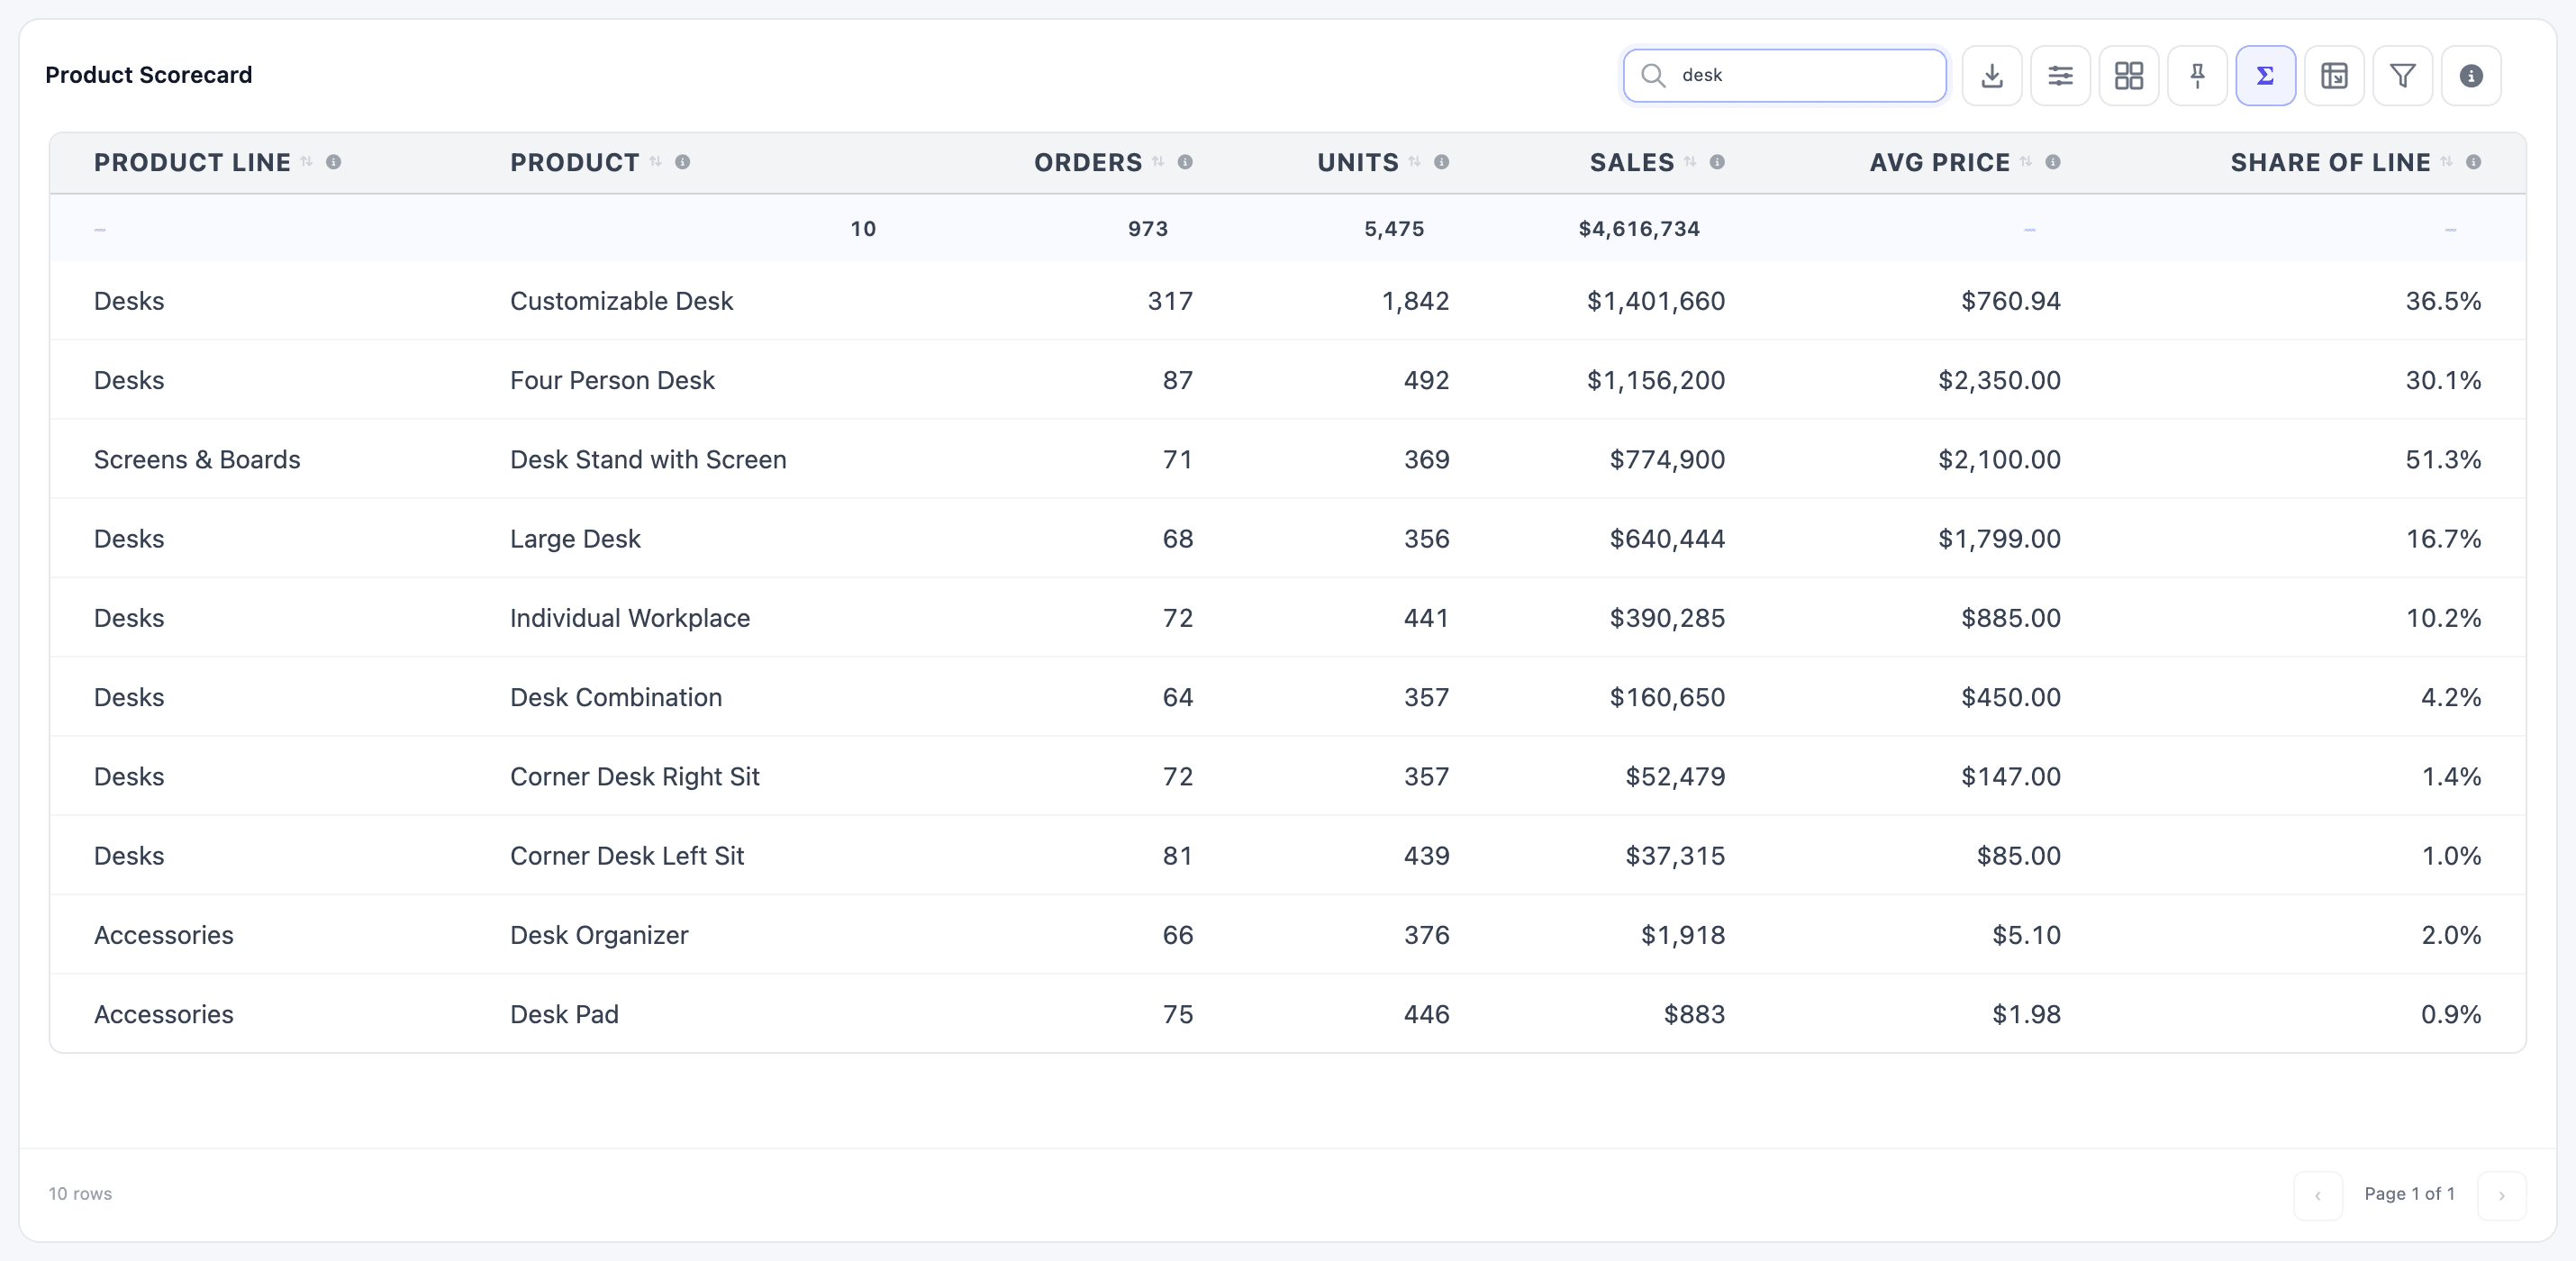
Section titled “Search”Type in Search… to keep only the rows where any column contains the text. Upper and lower case don’t matter. The table jumps back to page 1, and the row count and the totals follow the search:
Click a column header to sort by it. Number columns sort from largest to smallest first, text columns from A to Z. Click again to reverse the order, and a third time to go back to the original order. The header shows ↓ or ↑ while sorted and ⇅ otherwise.
Only one column sorts at a time. A column whose builder unticked Allow sorting by this column can’t be sorted.
Column filters
Section titled “Column filters”Click Column Filters (the funnel) to add a row of filters under the headers. Each column gets an operator and a value box:
- Text columns: Contains (the default), Does not contain, Equals, Starts with, Ends with. Case doesn’t matter.
- Number columns: = (the default), ≠, >, <, ≥, ≤, Between. Between shows Min and Max boxes; leave Max empty for “at least Min”.
- Date columns: On (the default), Before, After, Between, with date pickers.
Filters on several columns combine: a row must pass all of them.
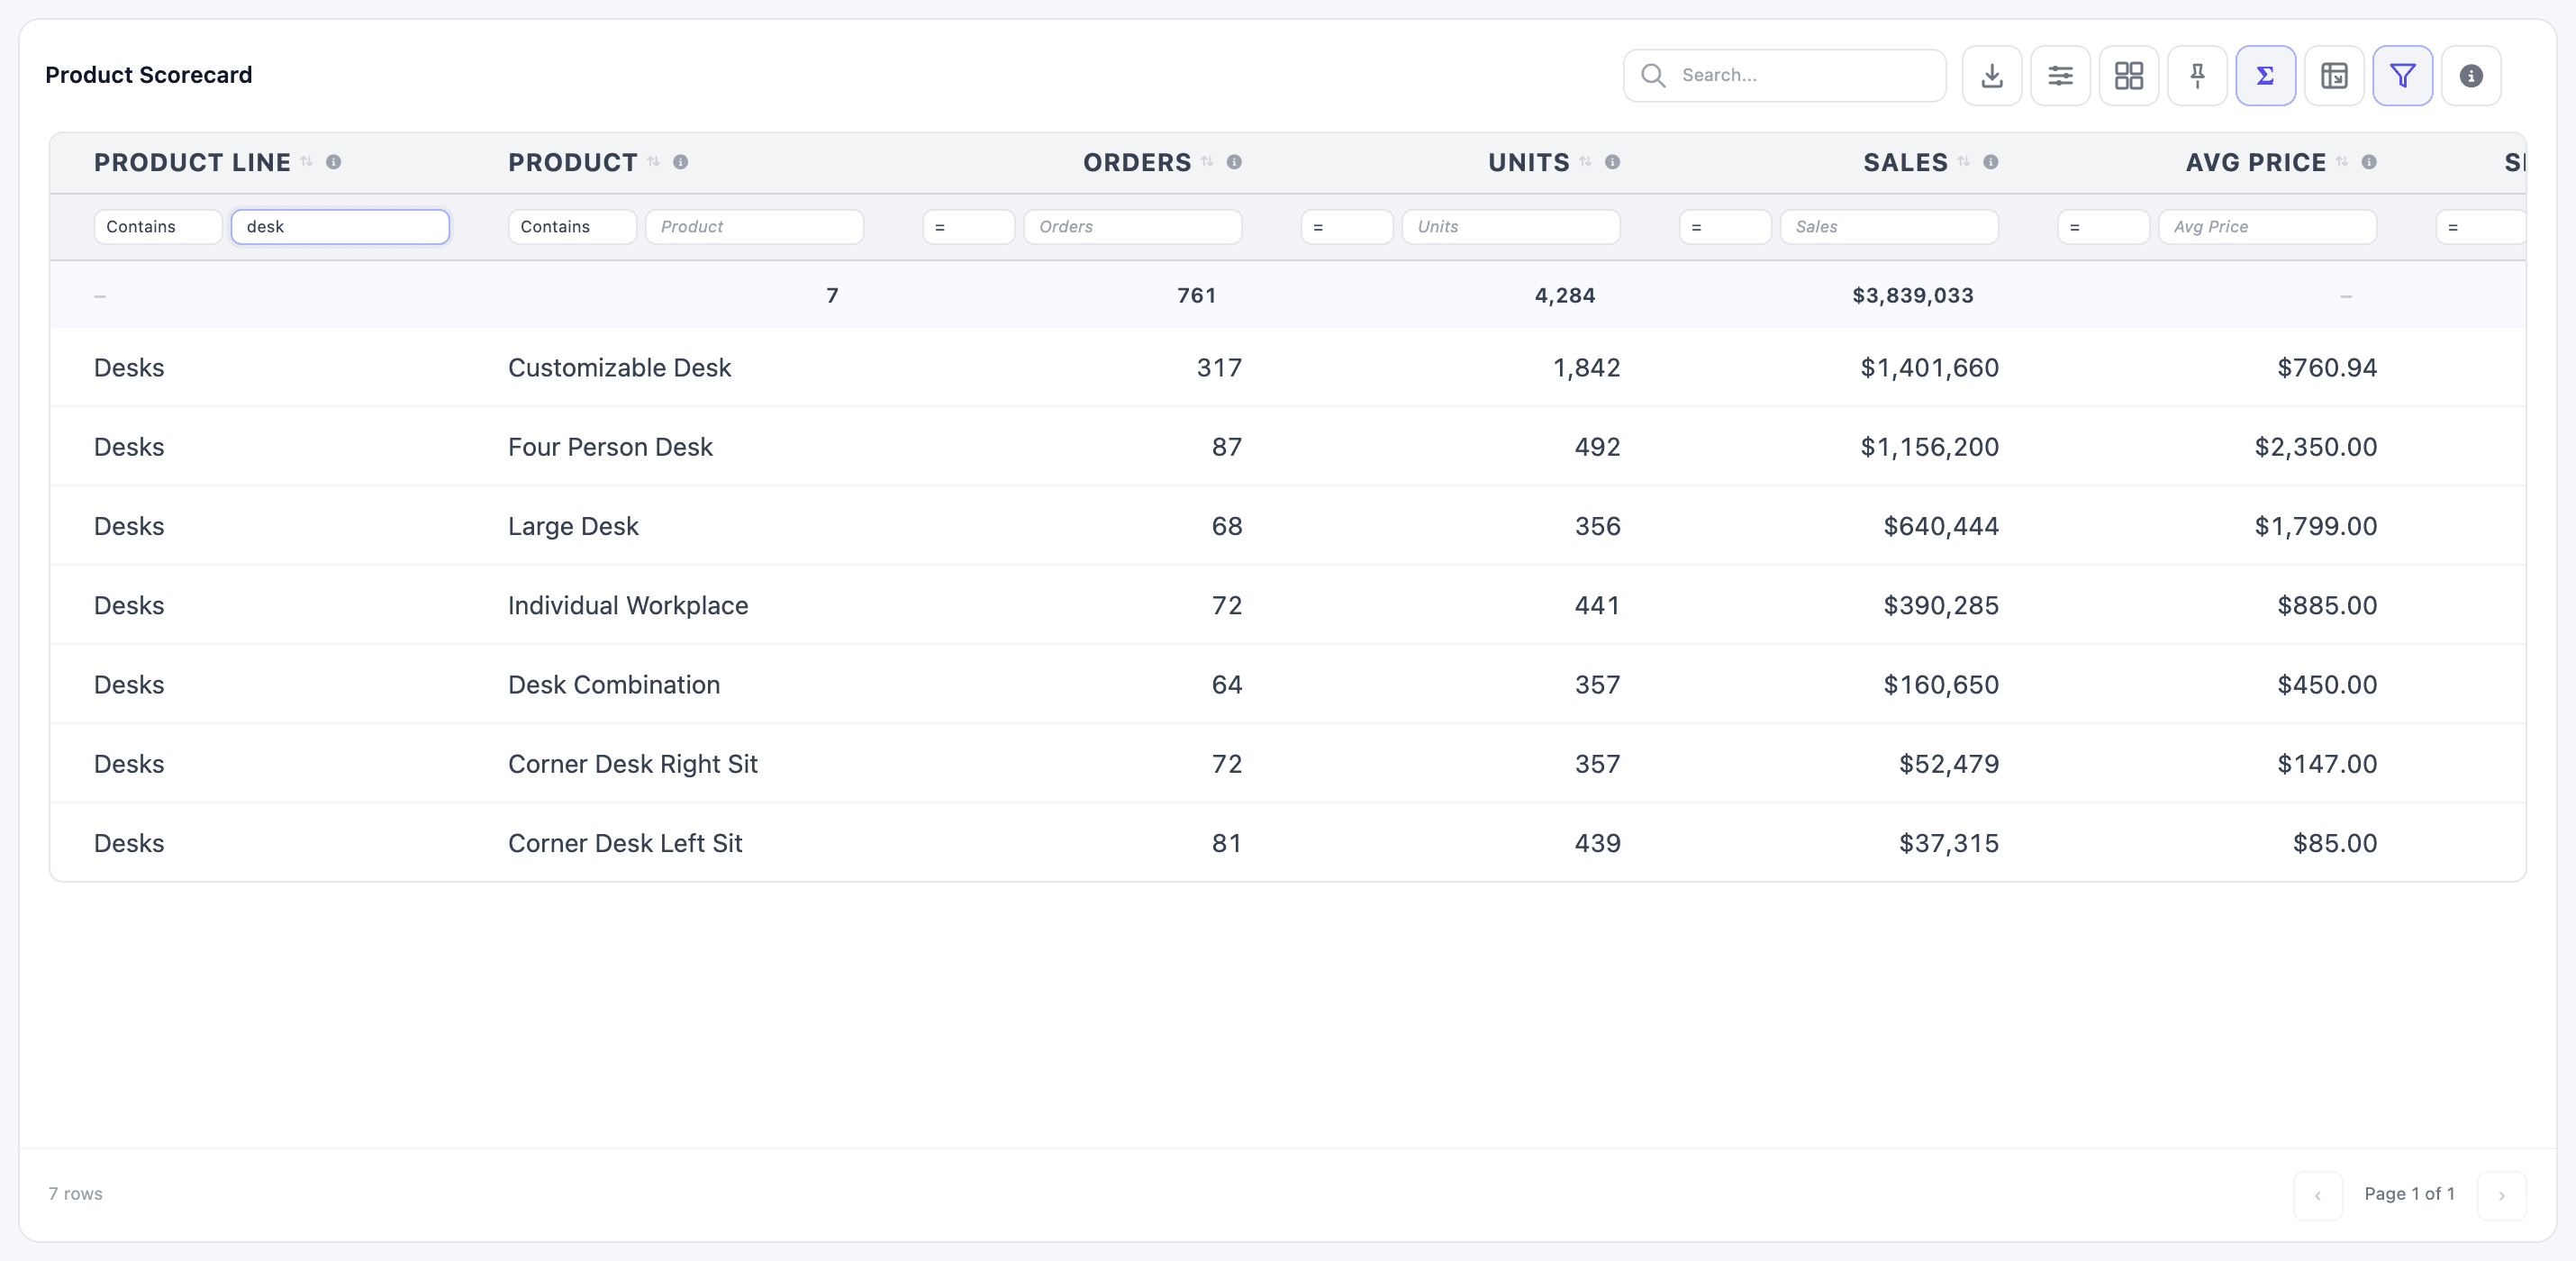
Column filters only narrow what’s on screen. To change which data the table fetches, use the widget’s filters or the dashboard’s filters.
Show and hide columns
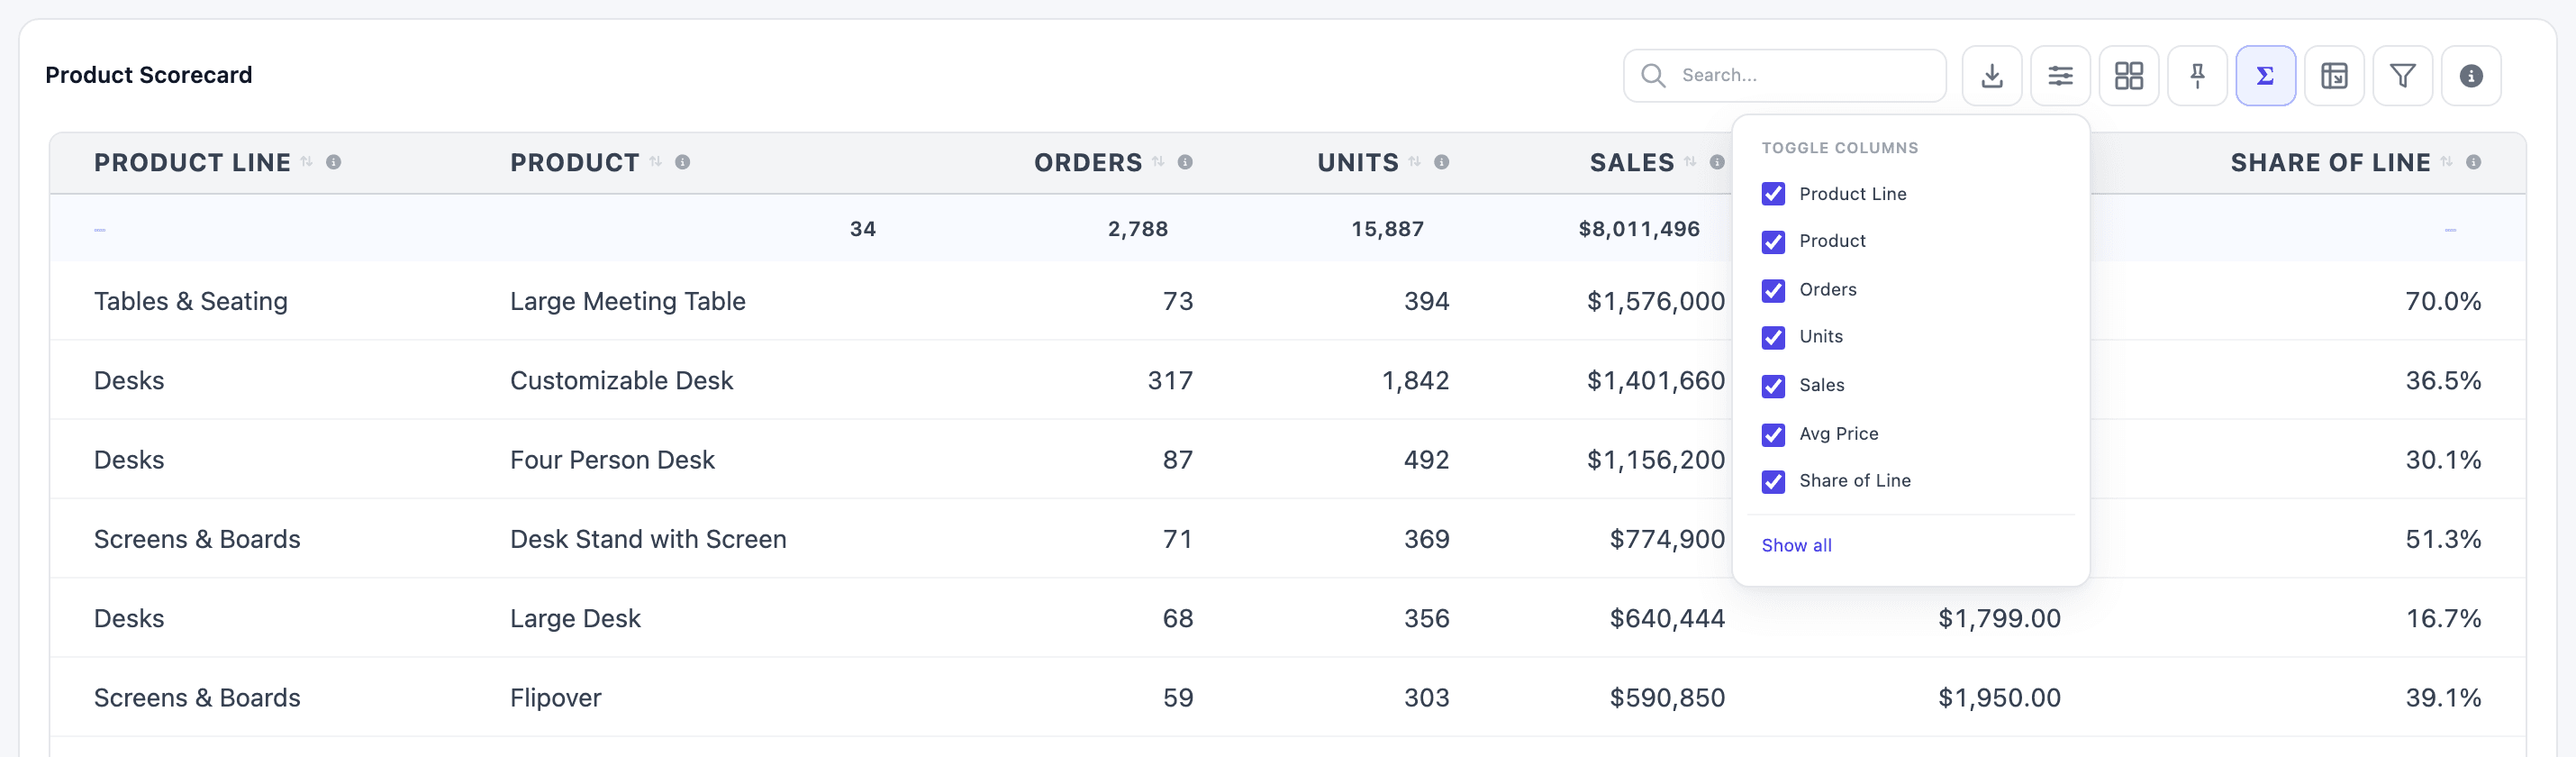
Section titled “Show and hide columns”Toggle Columns lists every column with a checkbox. Untick one to hide it; Show all brings them all back. Columns the builder set to Hidden by default start unticked, and columns set to Always hidden aren’t listed at all.
Pin columns
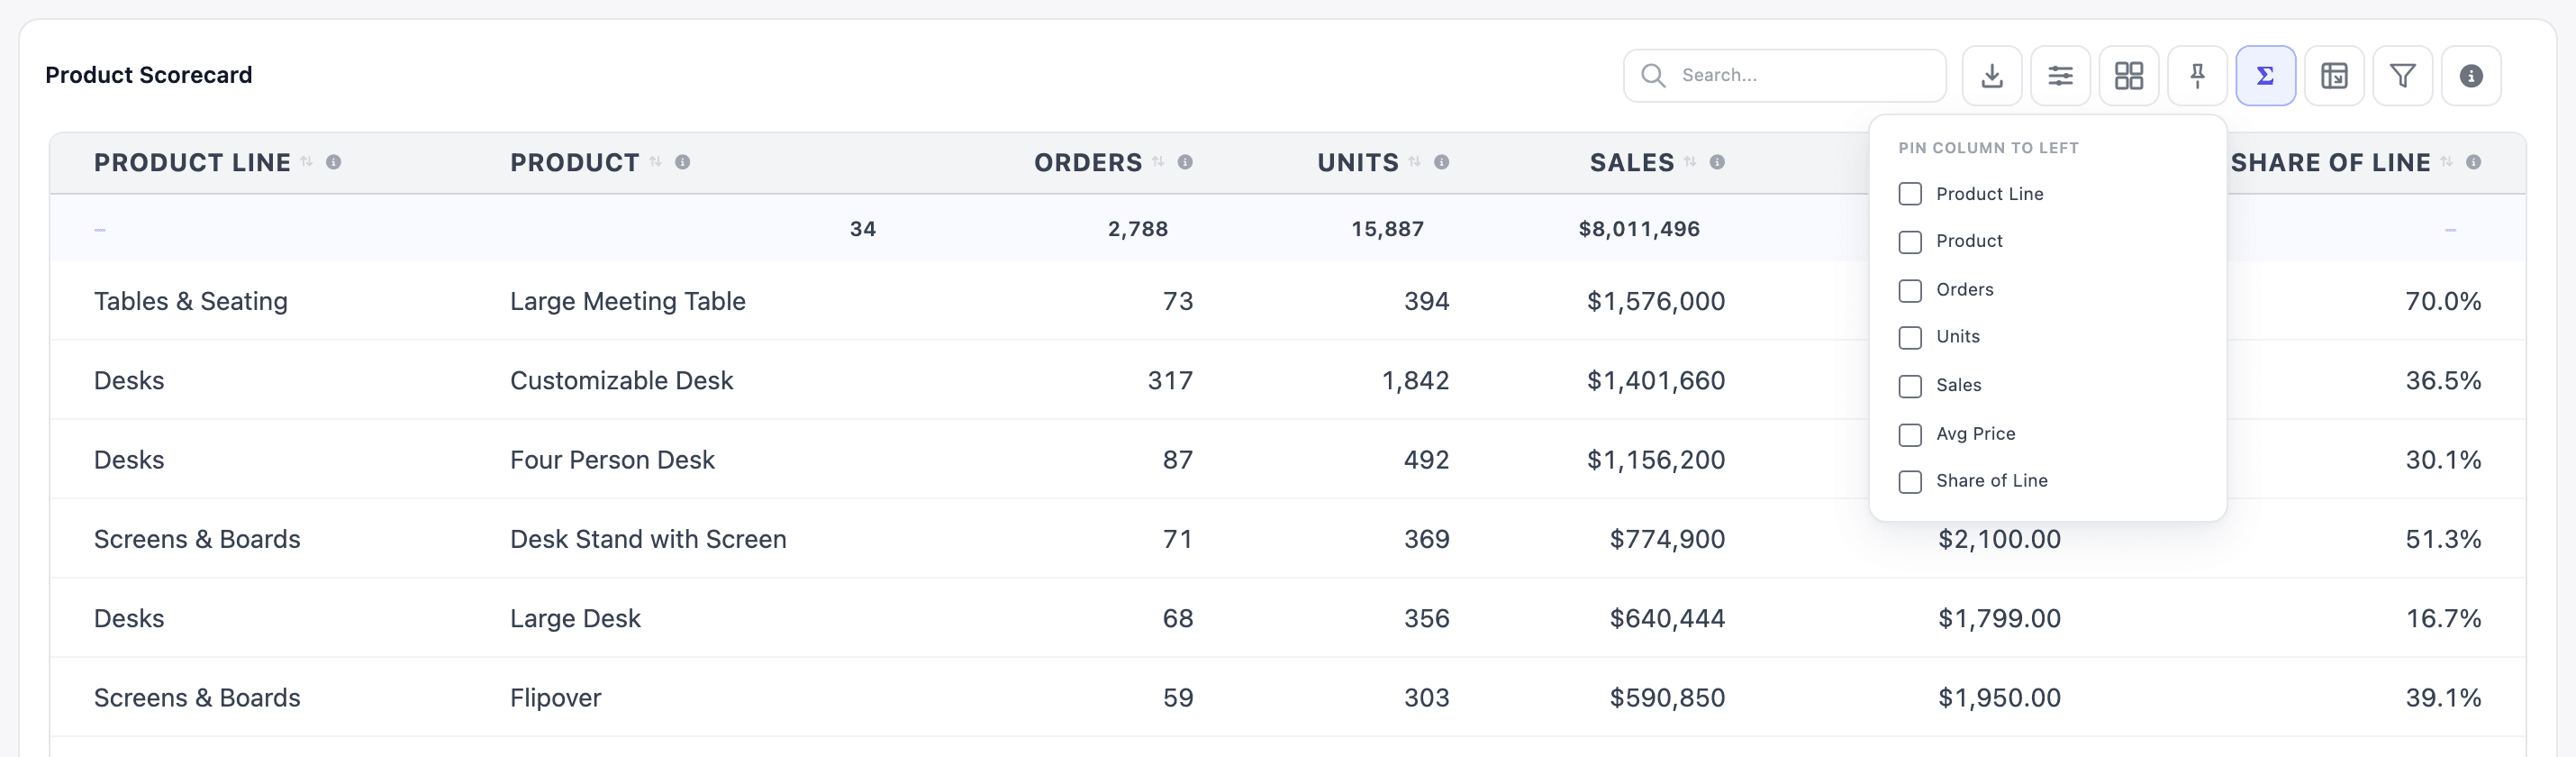
Section titled “Pin columns”Pin Columns (menu Pin column to left) keeps the ticked columns at the left edge while you scroll a wide table sideways, in the order you tick them. The button shows how many columns are pinned, and Clear all unpins them.
Builders can pin columns for everyone with Pin Columns (Front-end) under Advanced on the Configuration tab.
Transpose
Section titled “Transpose”Transpose turns columns into rows, which reads better when a table has few rows and many columns. Product Line Summary has five product lines and four figures; transposed, the product lines run across the top:
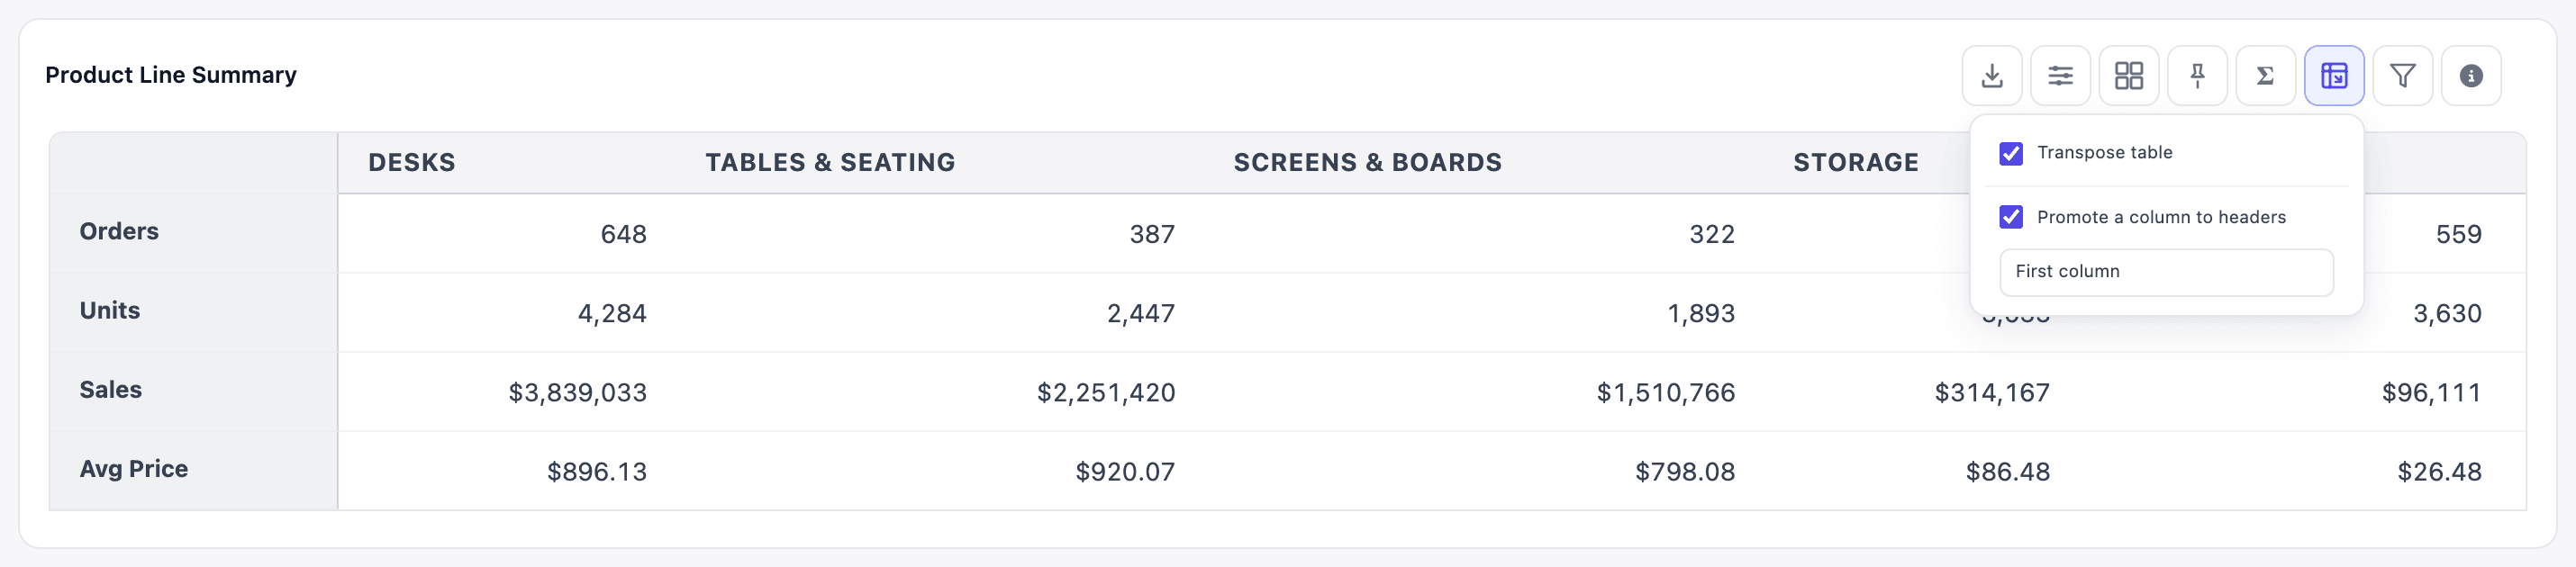
The menu has:
- Transpose table: flips the table.
- Promote a column to headers: uses one column’s values as the new headers. Without it the headers are blank.
- A list to pick that column. First column is the default.
Builders can open the table transposed by default with Transpose table under Advanced, and set the same two header options there.
Transposing only changes the layout of the page on screen. While transposed there’s no totals row, no sorting by header, no column filters, no row selection and no clicking through to records. Exports keep the normal layout.
Export
Section titled “Export”Export offers two formats:
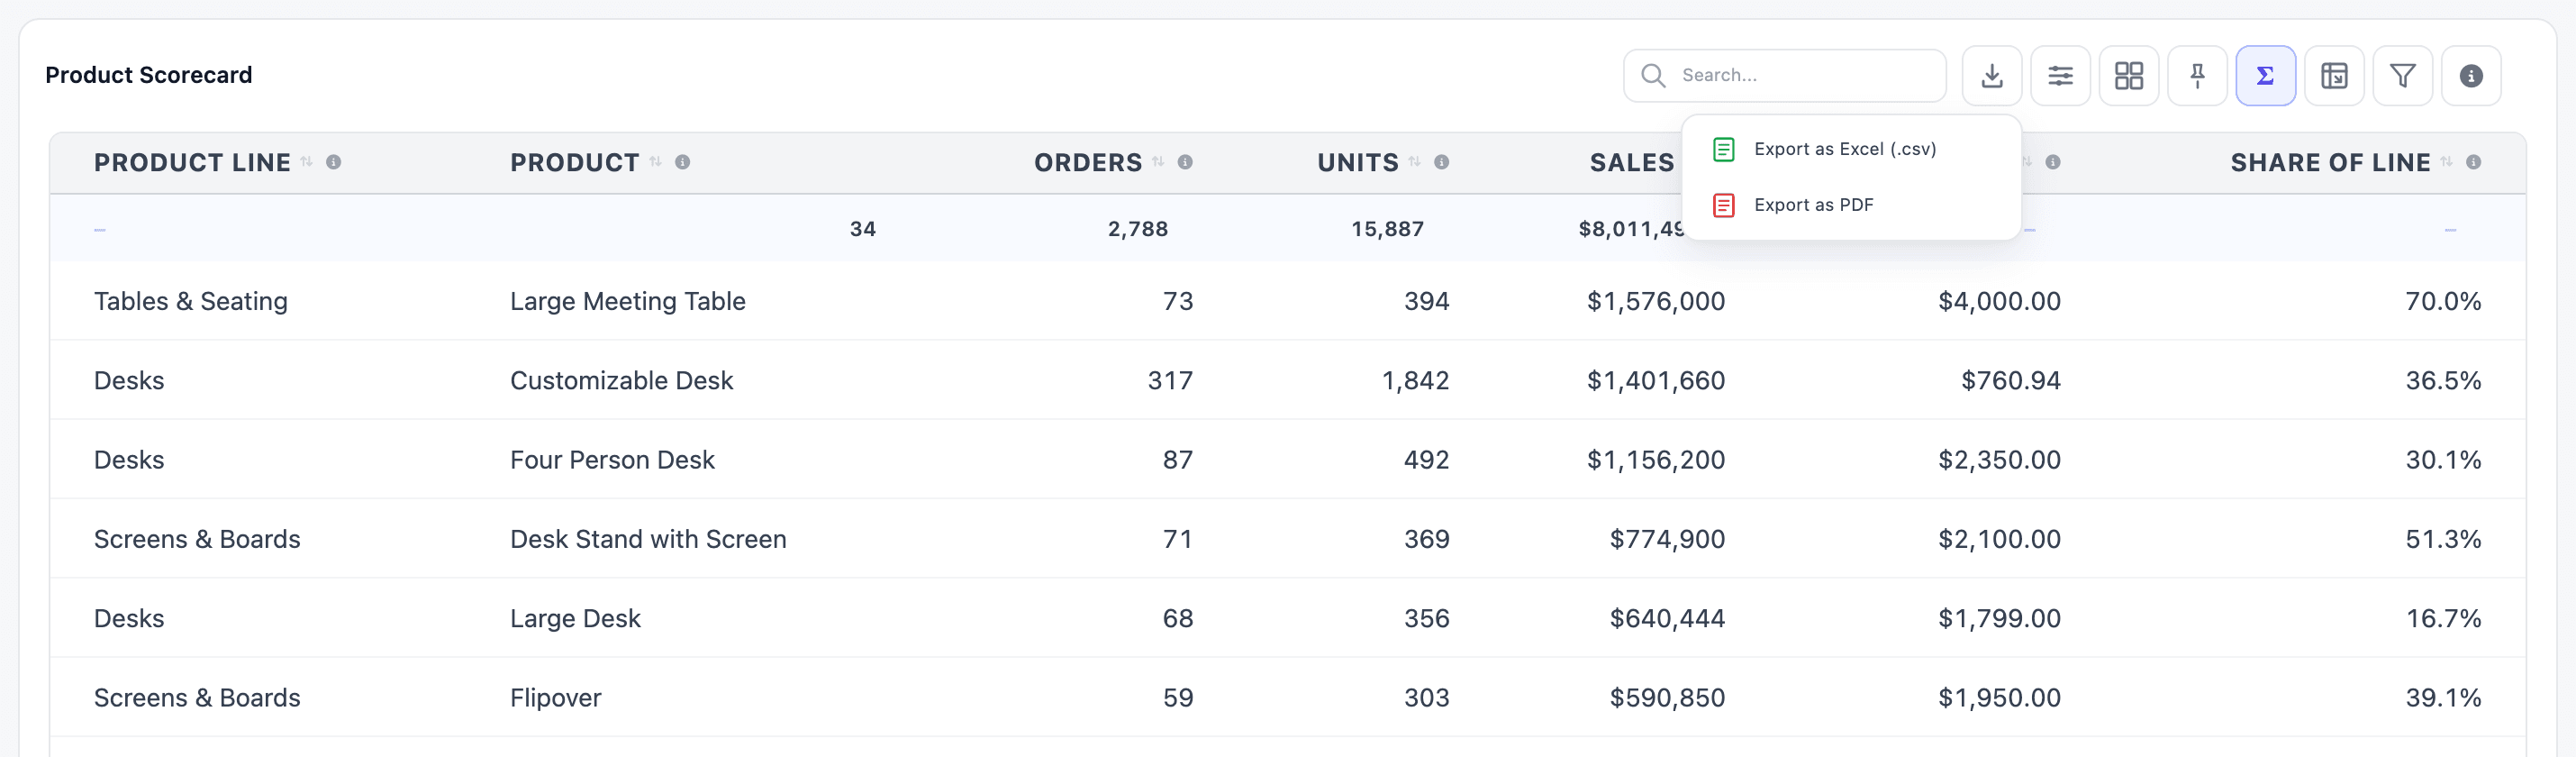
- Export as Excel (.csv) downloads a CSV file named after the table, such as
Product Scorecard.csv. Despite the label, it’s a CSV file, not an .xlsx workbook. Excel opens it directly, accents and Arabic included. - Export as PDF opens a printable copy of the table in a new browser window and starts the browser’s print dialog. Choose Save as PDF as the printer. Your browser must allow pop-ups for the dashboard.
Both exports contain:
- The visible columns, in their on-screen order. Hidden columns are left out.
- All rows that match the current search and column filters, on every page.
- The values formatted as on screen, such as
$1,401,660or36.5%. - The totals row, if it’s showing, right under the header.
- Groups as you see them: a collapsed group exports as one line, an expanded one with its rows.
Hover the ⓘ button to read the table’s description, followed by how long the data took to fetch.
Hide controls from viewers
Section titled “Hide controls from viewers”Builders can remove any toolbar control from a table, for example on a small summary where search and paging only add clutter. In the Dashboard Builder, select the table, open Configuration, expand Advanced, and tick the controls to hide under Toolbar:
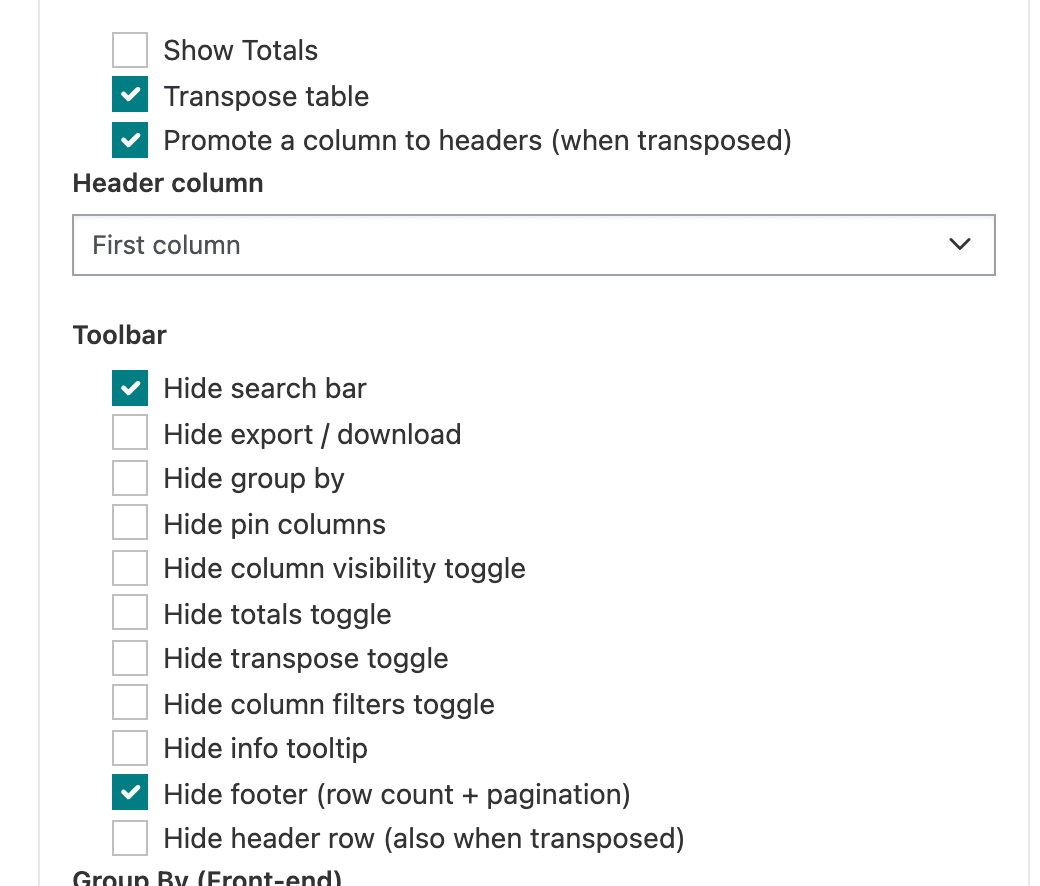
| Option | Hides |
|---|---|
| Hide search bar | The search box |
| Hide export / download | The Export button |
| Hide group by | The Group By button and the × on grouping chips. A default grouping still applies. |
| Hide pin columns | The Pin Columns button. Default pins still apply. |
| Hide column visibility toggle | The Toggle Columns button |
| Hide totals toggle | The Σ button. Show Totals still decides whether the row shows. |
| Hide transpose toggle | The Transpose button |
| Hide column filters toggle | The Column Filters button |
| Hide info tooltip | The ⓘ button |
| Hide footer (row count + pagination) | The row count and page buttons. All rows then show on one page that scrolls inside the widget. |
| Hide header row (also when transposed) | The column headers, and with them header sorting |
Product Line Summary above hides the search bar and the footer.