

Sales vs target
Targets live in a target plan: planned numbers per month, quarter or year, optionally split by team, branch or category. A table can then show the plan as a column next to the actual figures. This recipe compares each sales team’s confirmed sales with its monthly target, for whatever dates the viewer picks.
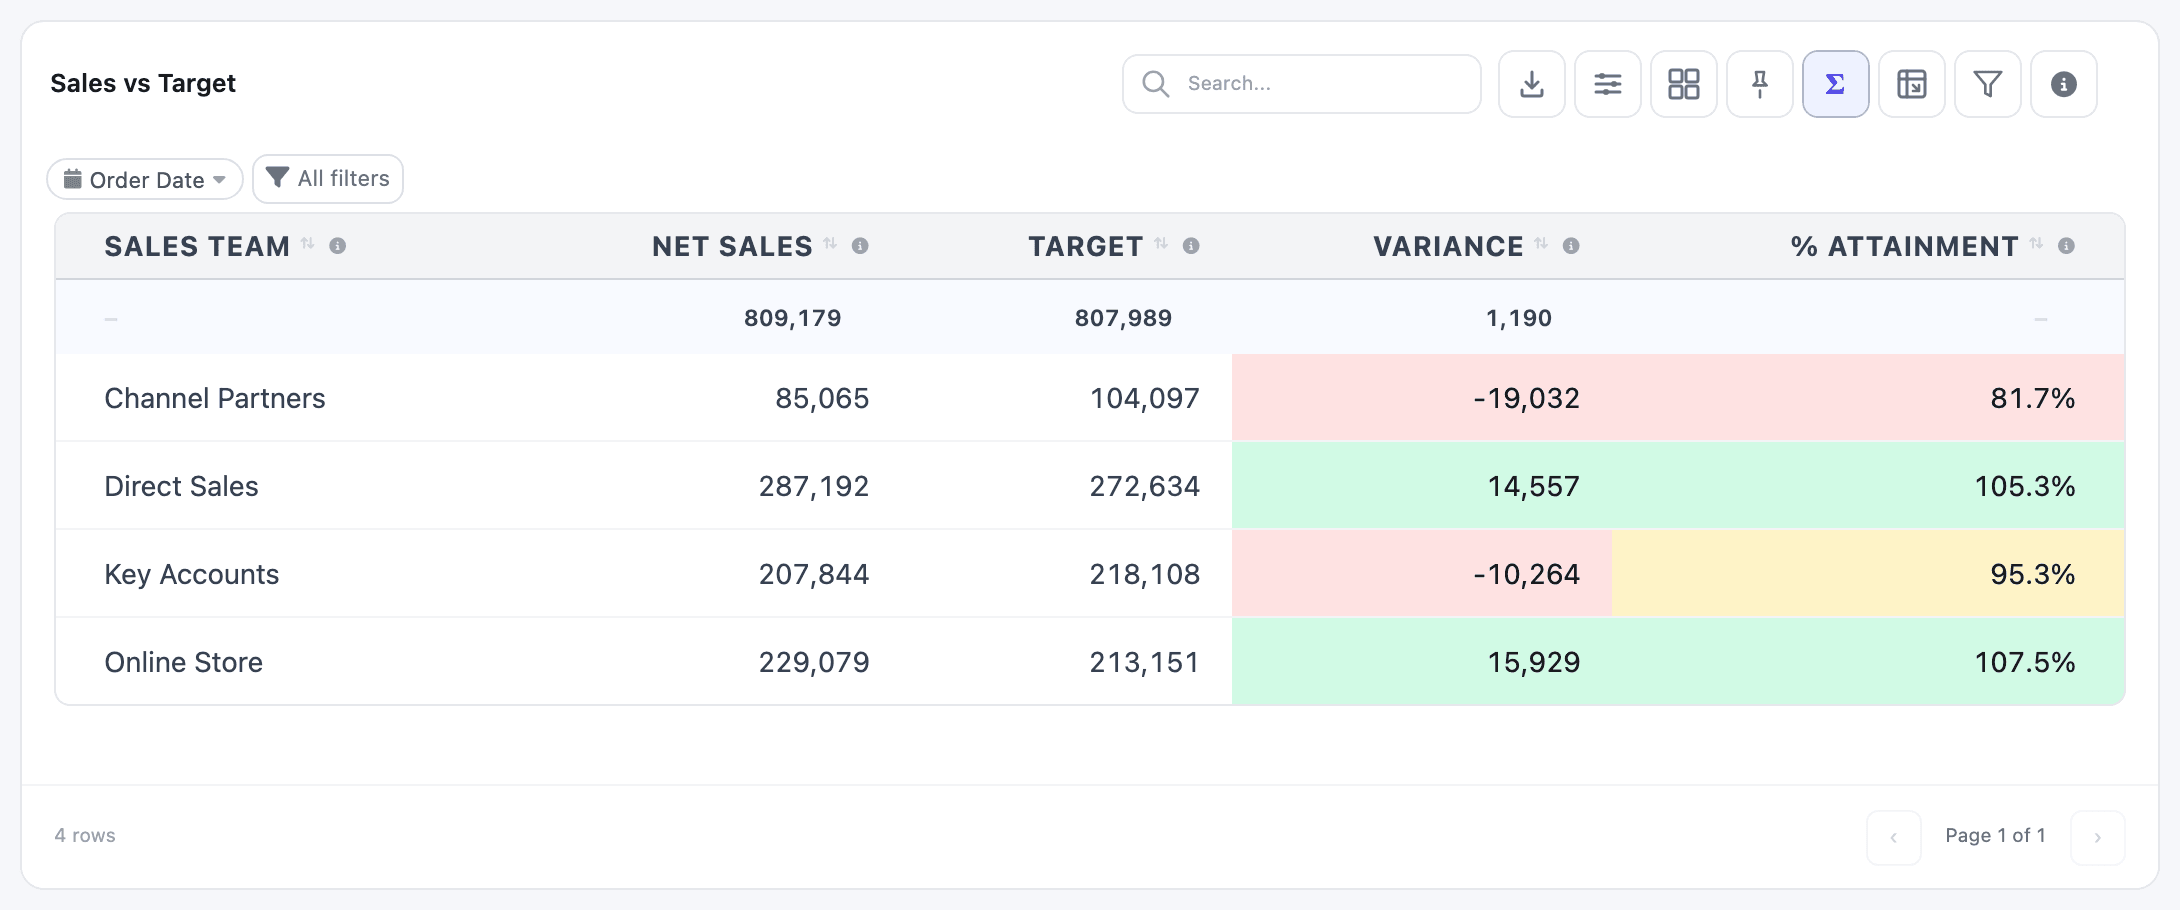
Targets are a table feature: tiles and charts can’t show them.
What you need
Section titled “What you need”- The Confirmed Sales Lines dataset from Compare with the previous period. It has the
untaxed_amount,order_dateandsales_teamcolumns the plan needs. - The Targets (SAAS) access right to create the plan. Everyone else can still see targets on dashboards. See Targets.
1. Create the target plan
Section titled “1. Create the target plan”-
Go to Odoo Dashboards → Targets → Target Plans and click New.
-
Type the name 2026 Team Sales Targets.
-
Set Data Source to Confirmed Sales Lines, Measure to the untaxed amount column and Date Field to the order date column. These pickers list the dataset’s columns by their Odoo field path, so they read
price_subtotalandorder_id.date_order. -
Keep Period Grain on Monthly, set Breakdown to the sales team column, and keep Pro-rate Partial Periods ticked.
-
Save, then click Activate. Only active plans can be used in a table.
-
Go to Targets → Plan Targets, pick the plan, and type each team’s number in each month of 2026. Fill → copies a row’s first value across the year. Click Save.
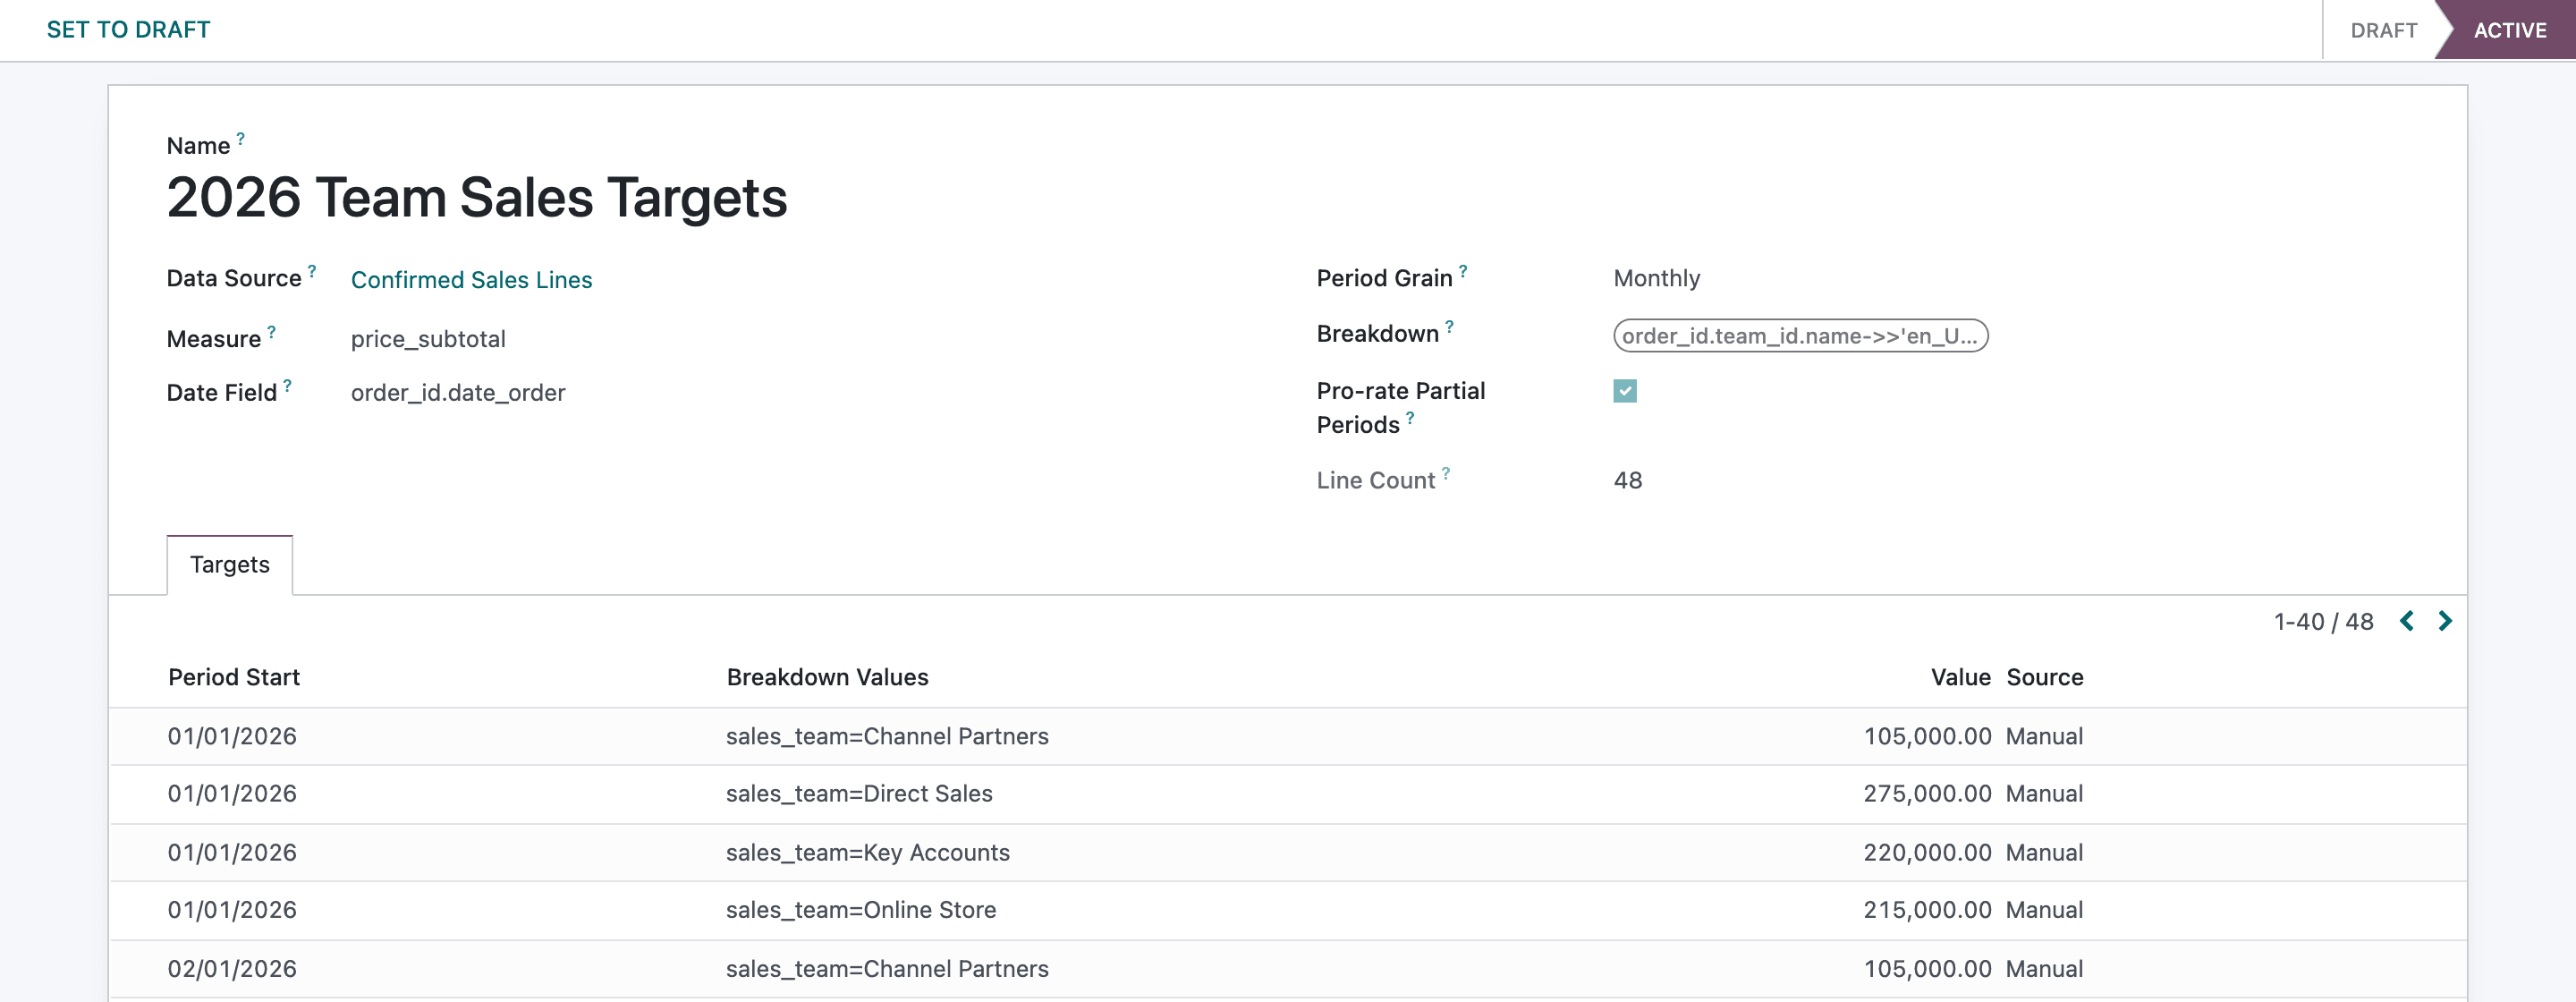
In this example the monthly targets are 105,000 for Channel Partners, 275,000 for Direct Sales, 220,000 for Key Accounts and 215,000 for Online Store.
2. Build the table
Section titled “2. Build the table”-
In the Dashboard Builder, click New Item, name it Sales vs Target, and pick Table and Confirmed Sales Lines.
-
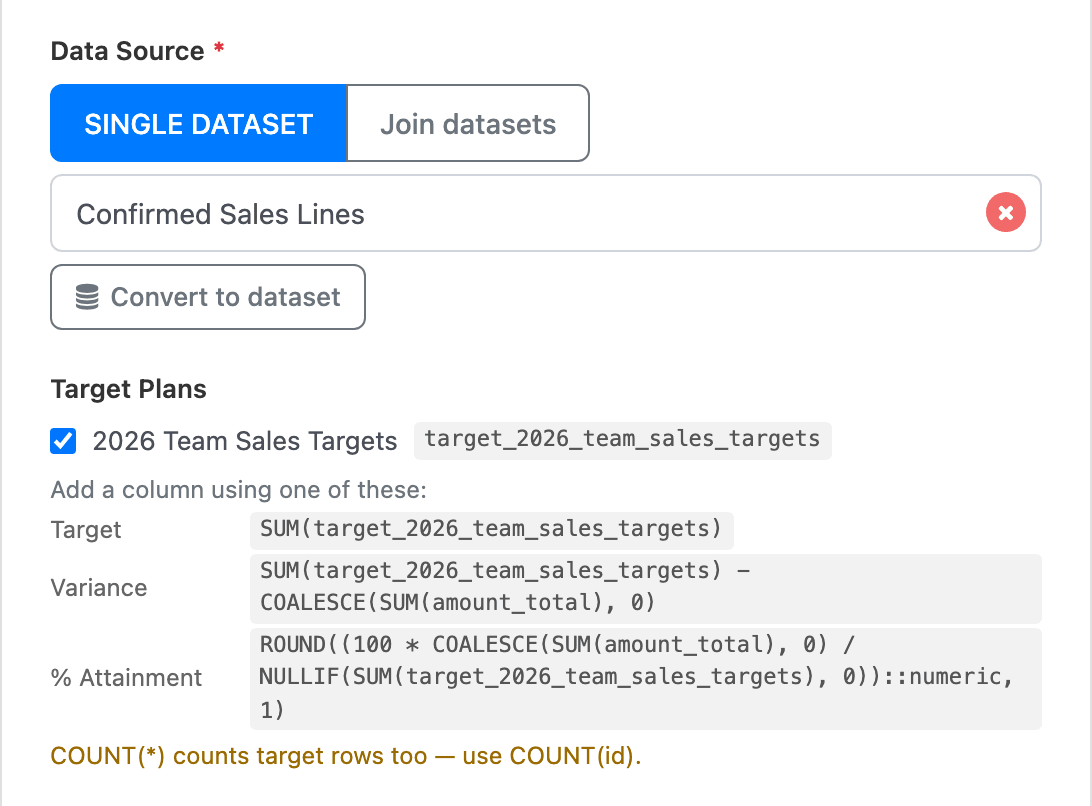
Under Target Plans on the General tab, tick 2026 Team Sales Targets. Its column,
target_2026_team_sales_targets, now appears in every field list.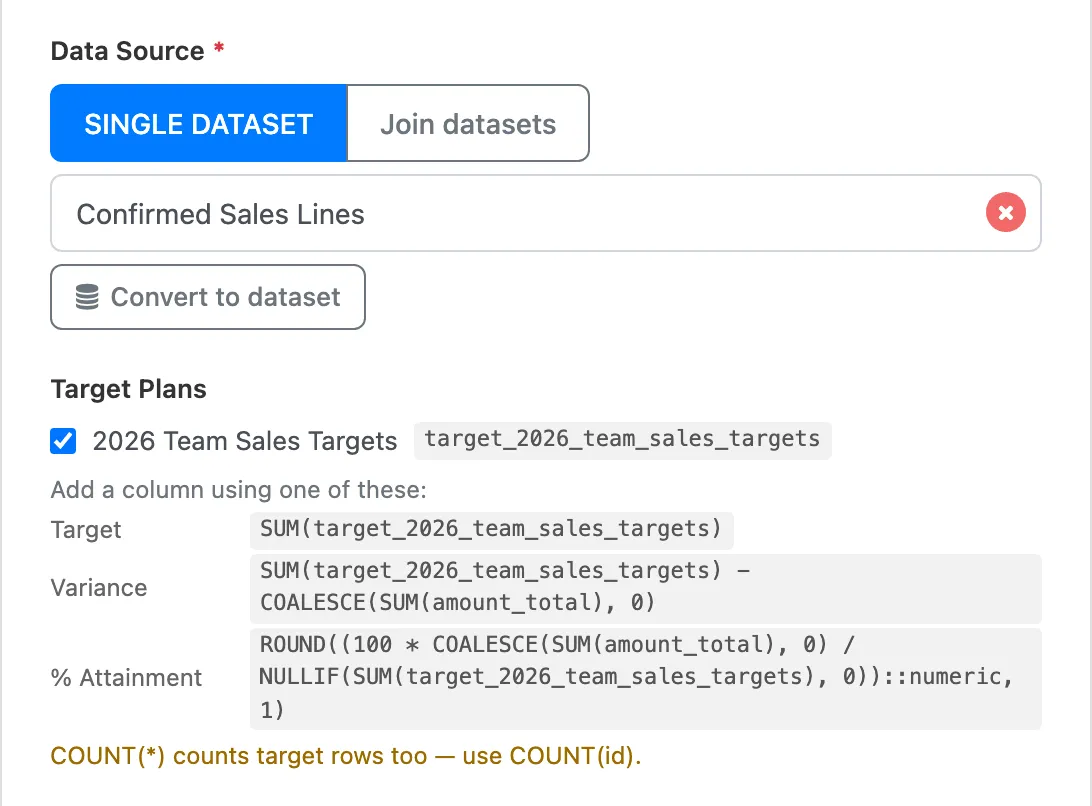
-
On the Configuration tab, add these columns, typing each expression in the Field box and pressing Enter:
Alias Field Sales Team sales_teamNet Sales SUM(untaxed_amount)Target SUM(target_2026_team_sales_targets)Variance COALESCE(SUM(untaxed_amount), 0) - SUM(target_2026_team_sales_targets)% Attainment ROUND((100 * COALESCE(SUM(untaxed_amount), 0) / NULLIF(SUM(target_2026_team_sales_targets), 0))::numeric, 1) -
Set Group By and Order By to sales_team.
-
Formats (gear → Format): the three amounts as Number with 0 decimals. % Attainment as Percentage with 1 decimal and Multiply by 100 unticked.
-
Colours (gear → Rules): on Variance, ≥
0green and <0red. On % Attainment, ≥100green, Between90and99.99amber, Between0.01and89.99red. -
On the Filters tab, add an Order Date filter on order_date with Is between and tick Show in Dashboard. Under Advanced, tick Show Totals. Click Save & Preview.
Why it works
Section titled “Why it works”- The plan adds target rows to the table’s data at query time. They carry the target in
target_2026_team_sales_targets, the period date inorder_dateand the team insales_team, and nothing in the other columns. The dataset itself doesn’t change. SUM(untaxed_amount)ignores the target rows (their amount is empty) andSUM(target_…)ignores the sales rows, so each column adds up only its own kind of row.COALESCEturns “no sales yet” into 0 so the variance still shows.- The Order Date filter narrows the targets too. Because the plan is pro-rated, a month’s target is spread evenly over its days. For 9 September to 8 October, Channel Partners gets 22/30 of September’s 105,000 plus 8/31 of October’s: 104,097.
- Filters on the breakdown column (here
sales_team) narrow the targets as well, so a team filter shows that team’s target. Filters on other columns, such as product, can’t: the table then shows a ⚠ icon on the target column, because the target stays broader than the sales.
Variations
Section titled “Variations”- Year to date. Pick 1 January to today as a custom range in the Date Filter. Pro-rating cuts the current month’s target to the days so far, so the comparison stays fair mid-month.
- Month by month. Group by the month of the order date instead of the team, for example with a Format custom field that truncates
order_dateto Month start, to see target and actual for each month. - Company-wide. Leave Breakdown empty in the plan; each period then has one number for everyone.
Related: Targets, Conditional formatting.