

Joins and unions
Sometimes one widget needs more than one dataset can give. Join datasets, in the widget’s Data Source, combines several datasets for that widget only:
- Join (match columns) puts columns side by side, matching rows on a key: order lines with their product, and the product with its category.
- Union (stack rows) puts rows under each other: units sold and units purchased in one table.
Nothing is added to the datasets themselves. The combination is saved with the widget, and other widgets don’t see it.
Join datasets: an example
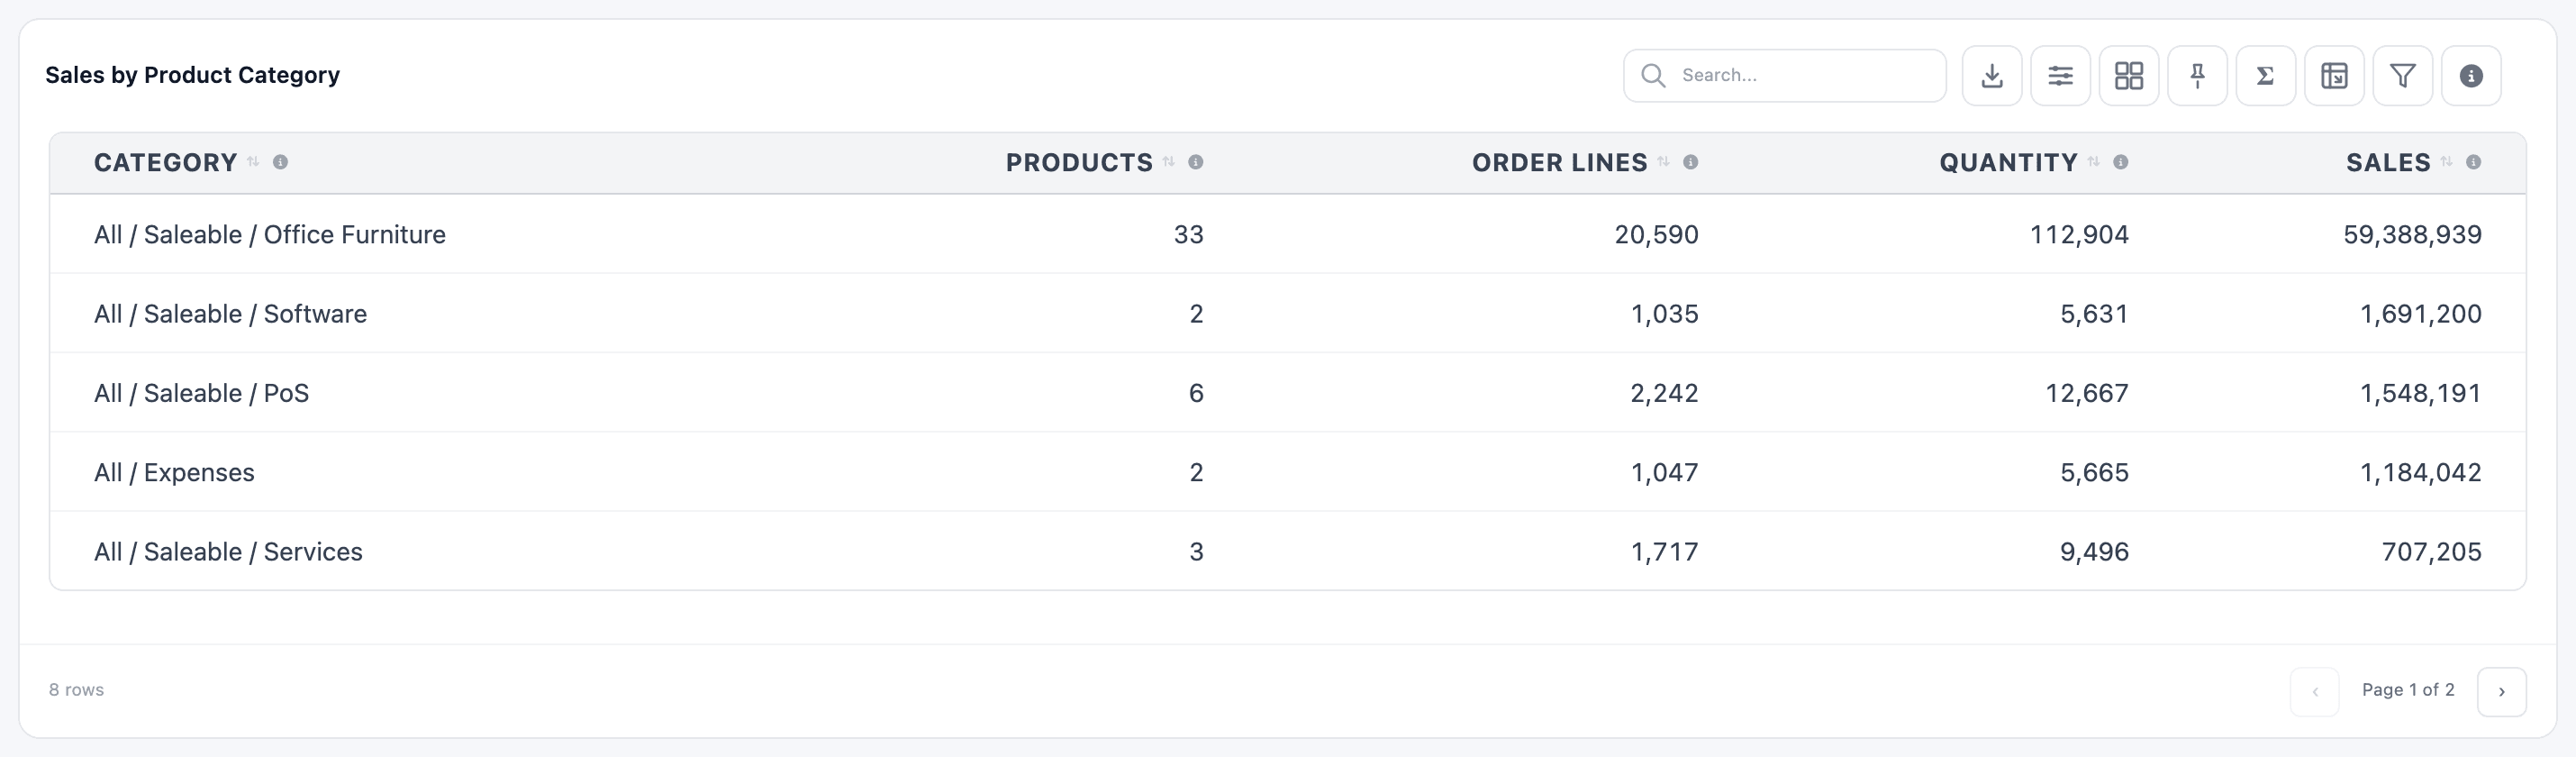
Section titled “Join datasets: an example”The Sales by Product Category table below needs order lines (quantity, amount), each line’s product (type, category ID) and each category’s full name. Those live in three datasets: Sale Order Lines, Product Catalogue and Product Categories.
-
In the Dashboard Builder, select the widget. On the General tab, under Data Source, click Join datasets.
-
Click Build combined source. The Build joined data source window opens, on Join (match columns).
-
In the first card, marked Base, pick the dataset that has one row per thing you count: Sale Order Lines.
-
Click Add dataset and pick Product Catalogue. A connector appears between the two cards.
-
On the connector, choose how rows are kept (see the table below) and the fields to match: prod_id in Sale Order Lines = id in Product Catalogue.
-
Add Product Categories the same way. On its connector, pick Product Catalogue as the left side and match category_id = id.
-
In each card, tick the columns the widget needs. Click the pencil next to a ticked column (Rename output column) to give it a clearer name, such as
prod_name→product. -
Click Done, then Save & Preview.
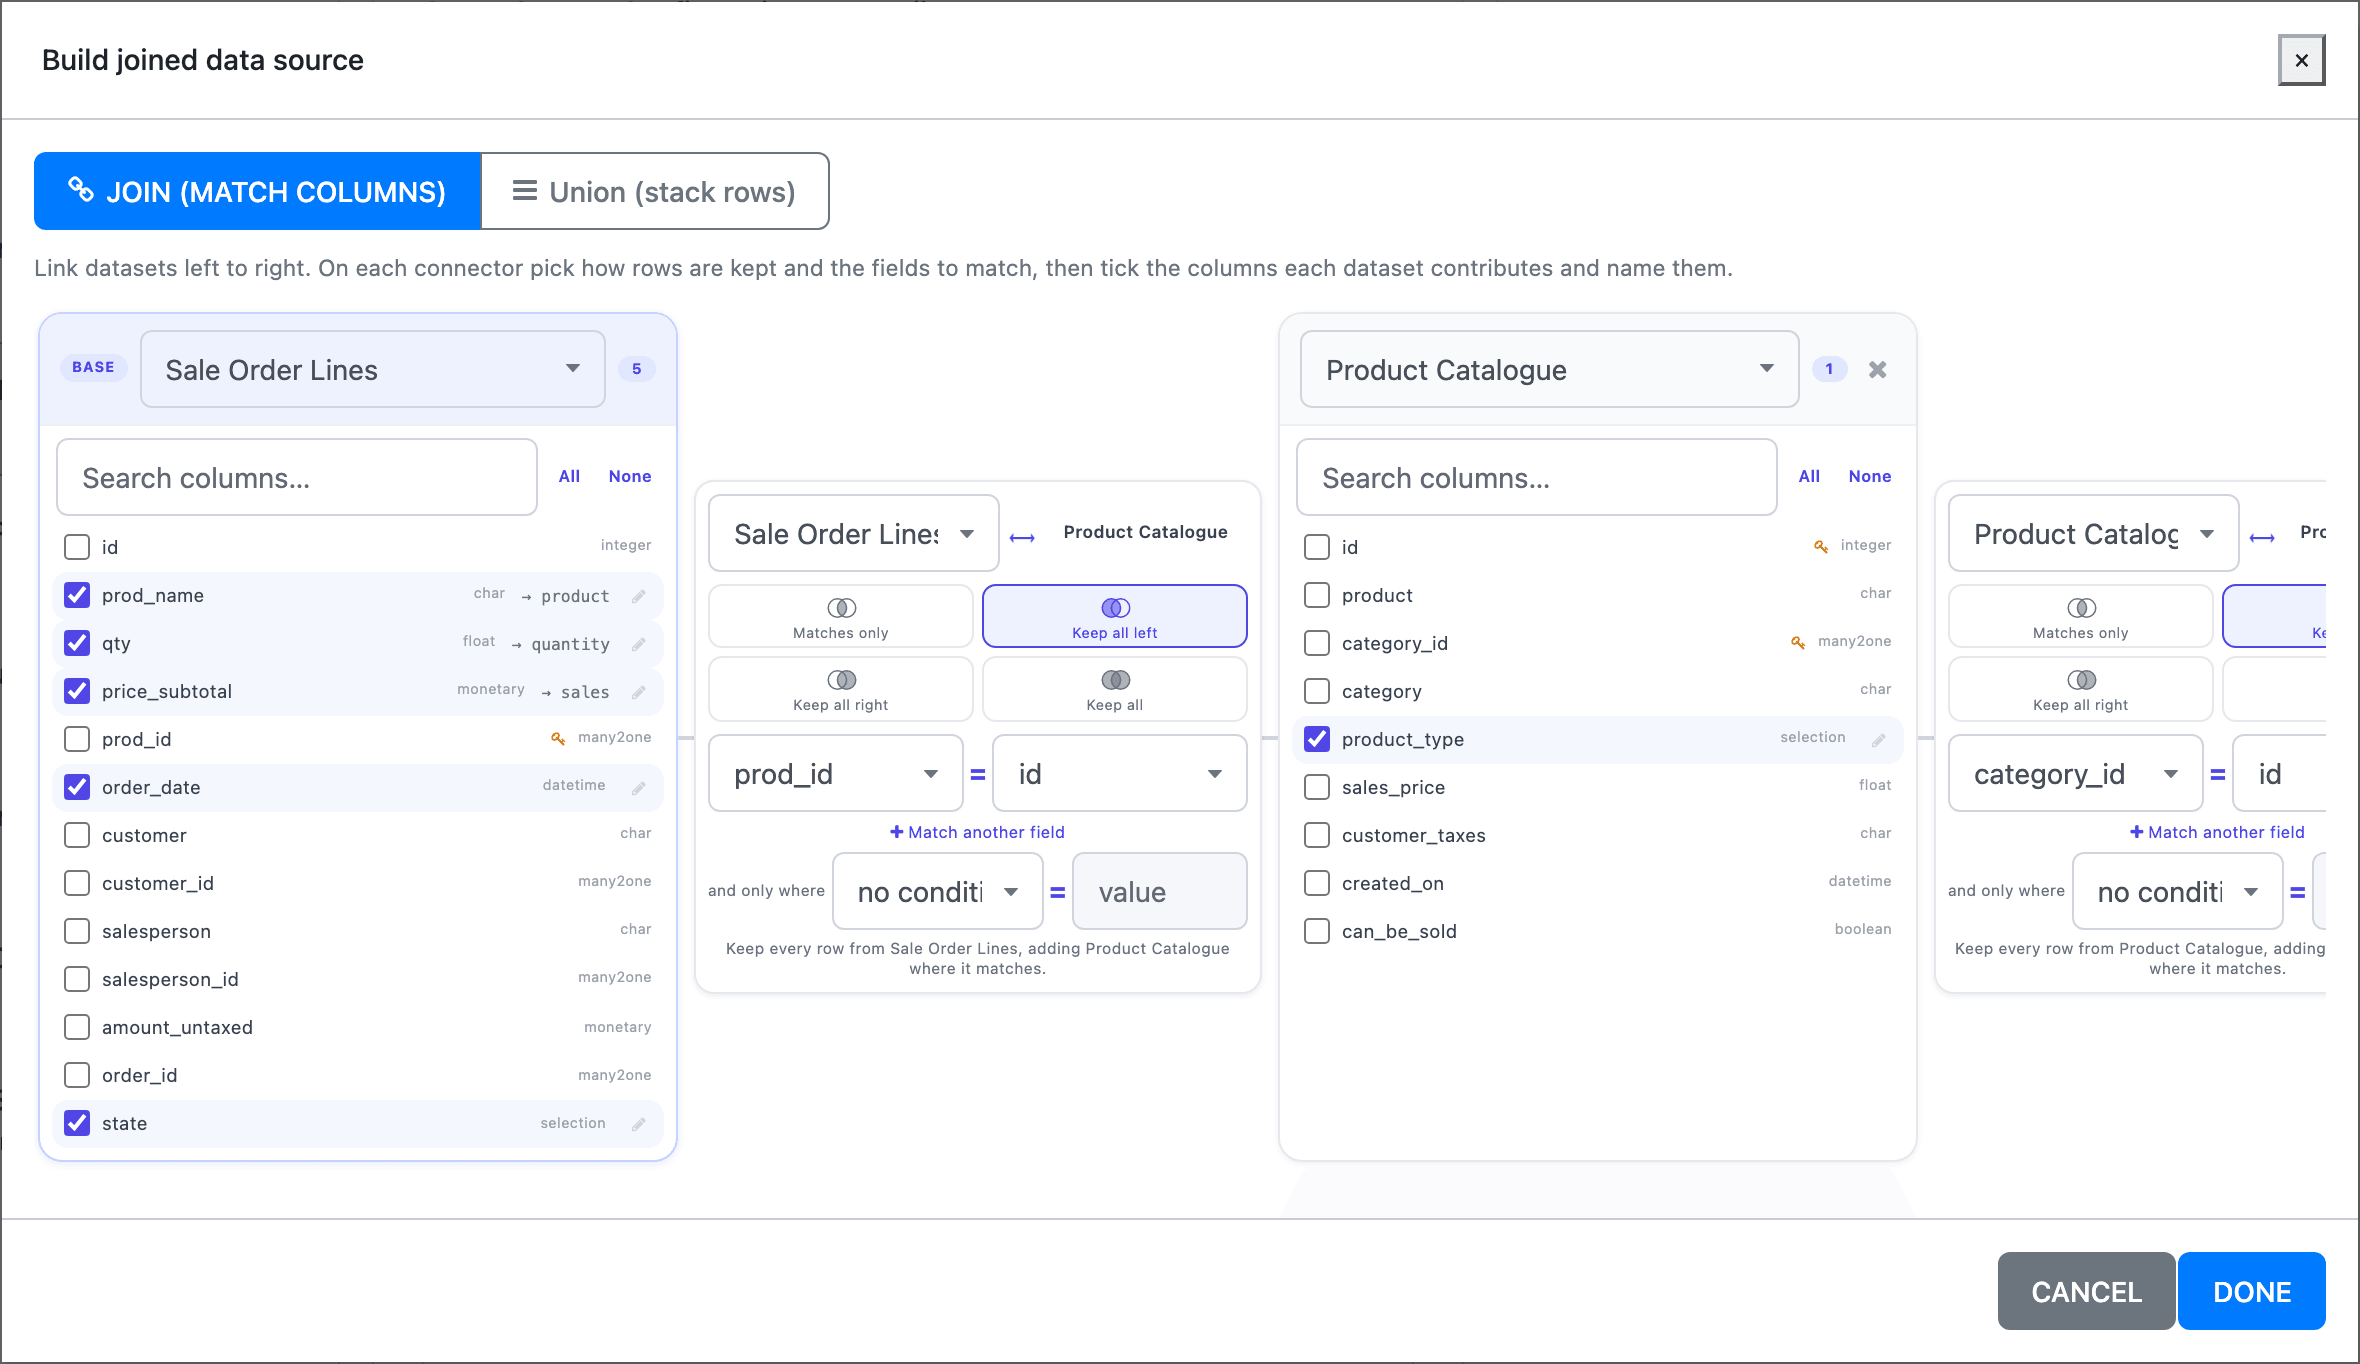
- Base dataset
- Join type
- Join key
- Match another field
- Join condition
- Picked column and its new name
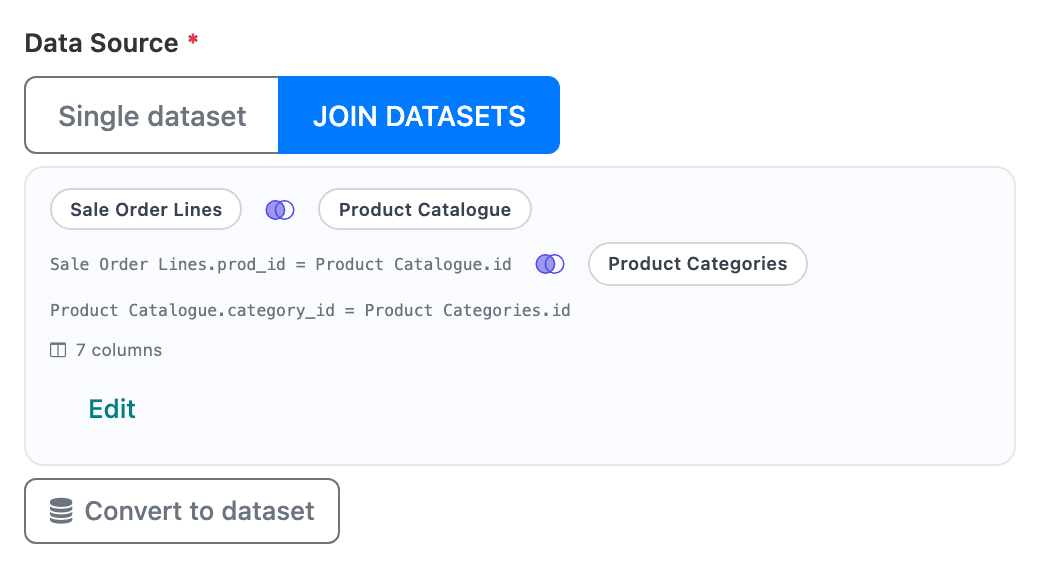
The window scrolls sideways when the chain is longer than the screen. The summary under Data Source then shows the chain, its keys and the number of columns. Click Edit to change it.
Join types
Section titled “Join types”| Button | Keeps | SQL |
|---|---|---|
| Matches only | Only rows that exist in both datasets. | INNER JOIN |
| Keep all left | Every row from the left dataset, plus matches from the right. The default. | LEFT JOIN |
| Keep all right | Every row from the right dataset, plus matches from the left. | RIGHT JOIN |
| Keep all | Every row from both datasets. | FULL OUTER JOIN |
A sentence under each connector says what it does, for example Keep every row from Sale Order Lines, adding Product Catalogue where it matches. Keep all left is the safe choice when the base dataset holds what you count: no line goes missing because its product has no category.
- The left side of a connector can be any earlier dataset in the chain, not only the one just before. Use the left selector on the connector.
- When both datasets have a column with the same name, the key is filled in for you, preferring names ending in
id. - Match on IDs where you can. Many2one columns in a model dataset hold the ID of the linked record, which is what the other dataset’s
idcolumn holds. - Match another field adds a second pair of keys that must also match, for rows only unique on two columns (an order and a product, say). Remove a pair with its ×.
- and only where … = … adds a condition to the match itself: a column and the value it must equal. Use it for Odoo’s generic references, where a
res_idonly means something together with its model, for exampleres_model=project.task. Because it’s part of the match, Keep all left still keeps rows that don’t match. One condition per connector.
Keys are a row-by-row match. If the right dataset has several rows for one key, each left row is repeated once per match, and sums go up accordingly. Join to datasets with one row per key where you can.
Picking columns
Section titled “Picking columns”- The widget’s fields are exactly the columns you tick, under their output names. A column that isn’t ticked doesn’t exist for the widget, even if it’s used as a key.
- Each card shows how many of its columns are picked. All and None tick or untick the columns that match the search box.
- Output names must be unique and use letters, digits and underscores. If you tick two columns with the same name, the second gets
_2. - A key icon marks the columns used as join keys.
Done stays disabled until the join is complete; the footer says what’s missing, for example Every joined dataset needs a join type, a parent and both keys. Cancel throws away every change made since the window opened.
Union: stack rows
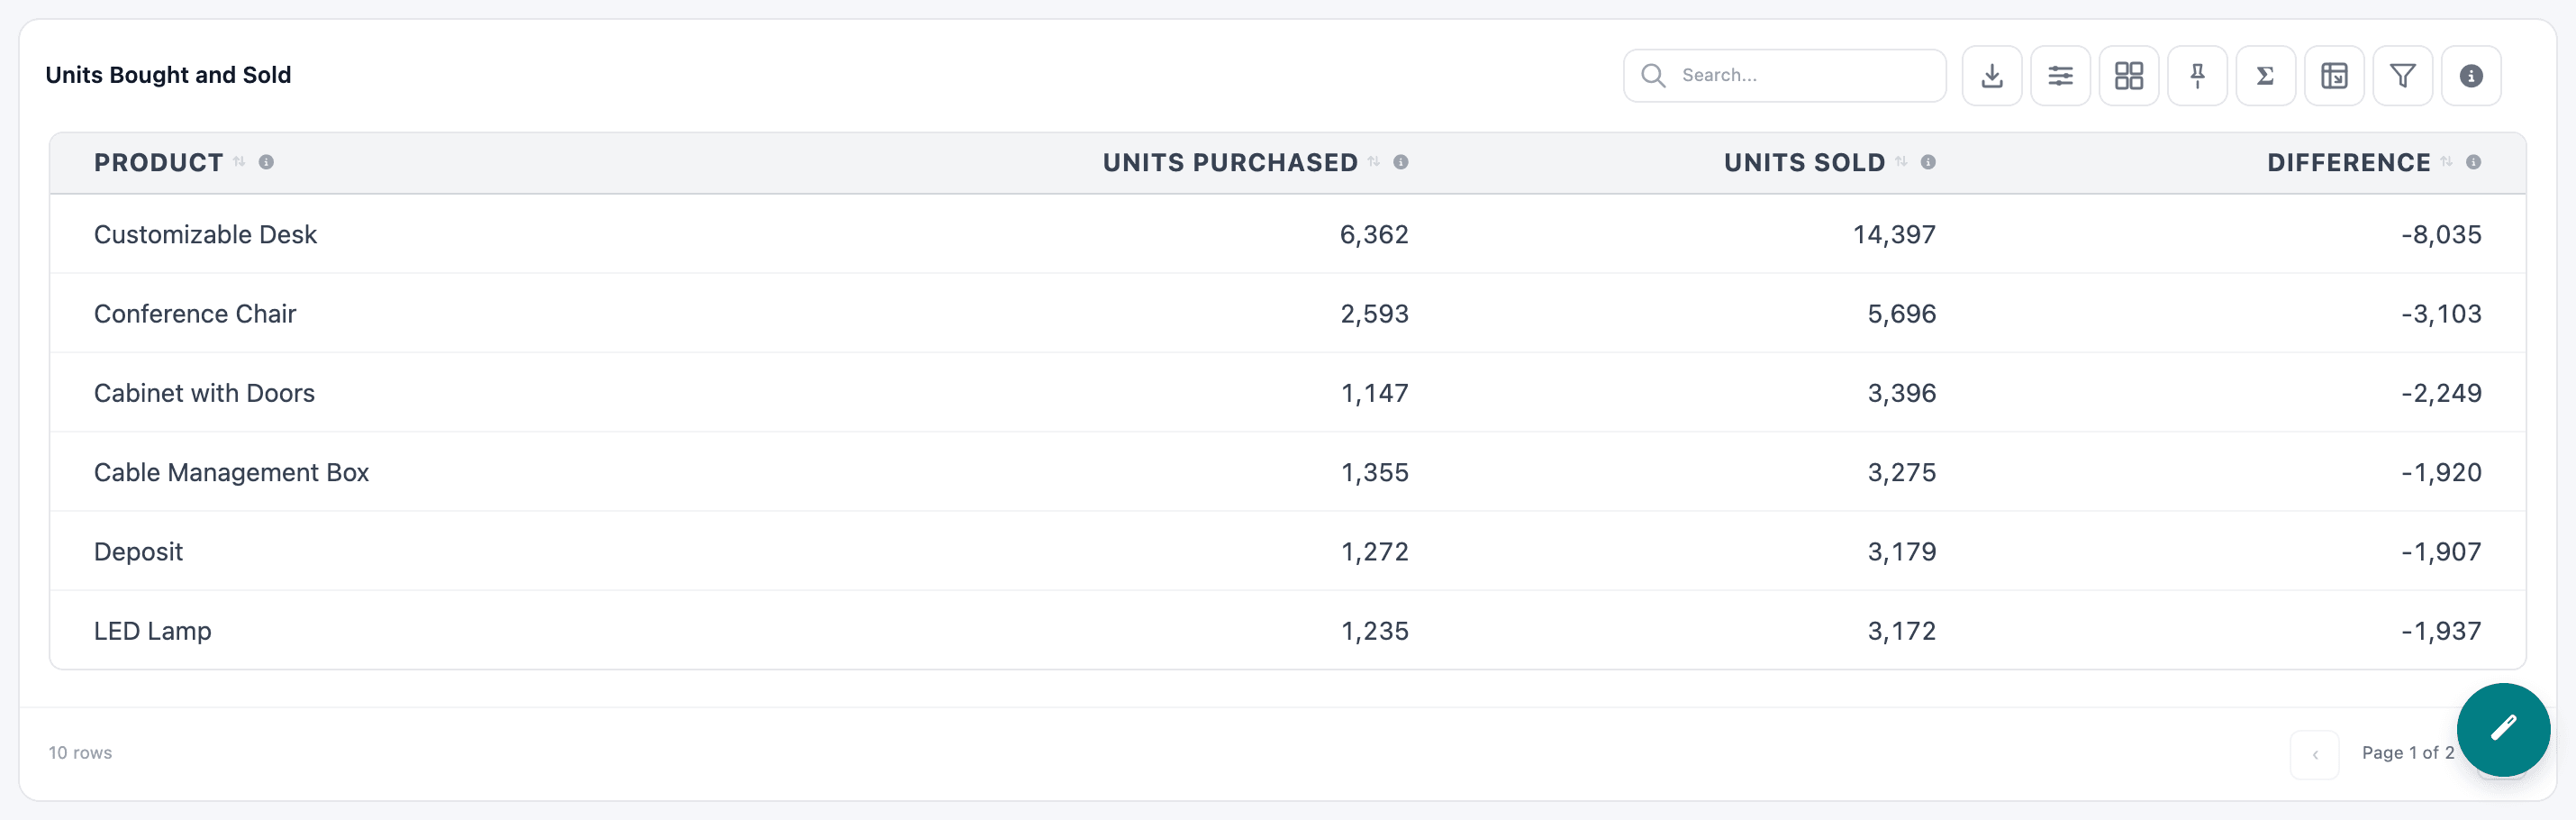
Section titled “Union: stack rows”A union puts the rows of several datasets in one list. The Units Bought and Sold table stacks Product Units Sold (one row per sales order line, with movement = Sold) and Product Units Purchased (one row per purchase order line, movement = Purchased), then sums each by product.
-
Under Data Source, click Join datasets, then Build combined source.
-
Click Union (stack rows).
-
Pick the Base dataset and tick the columns the result should have.
-
Click Add dataset and pick the next dataset. Its card shows which of the base columns it supplies.
-
Click Done, then Save & Preview.
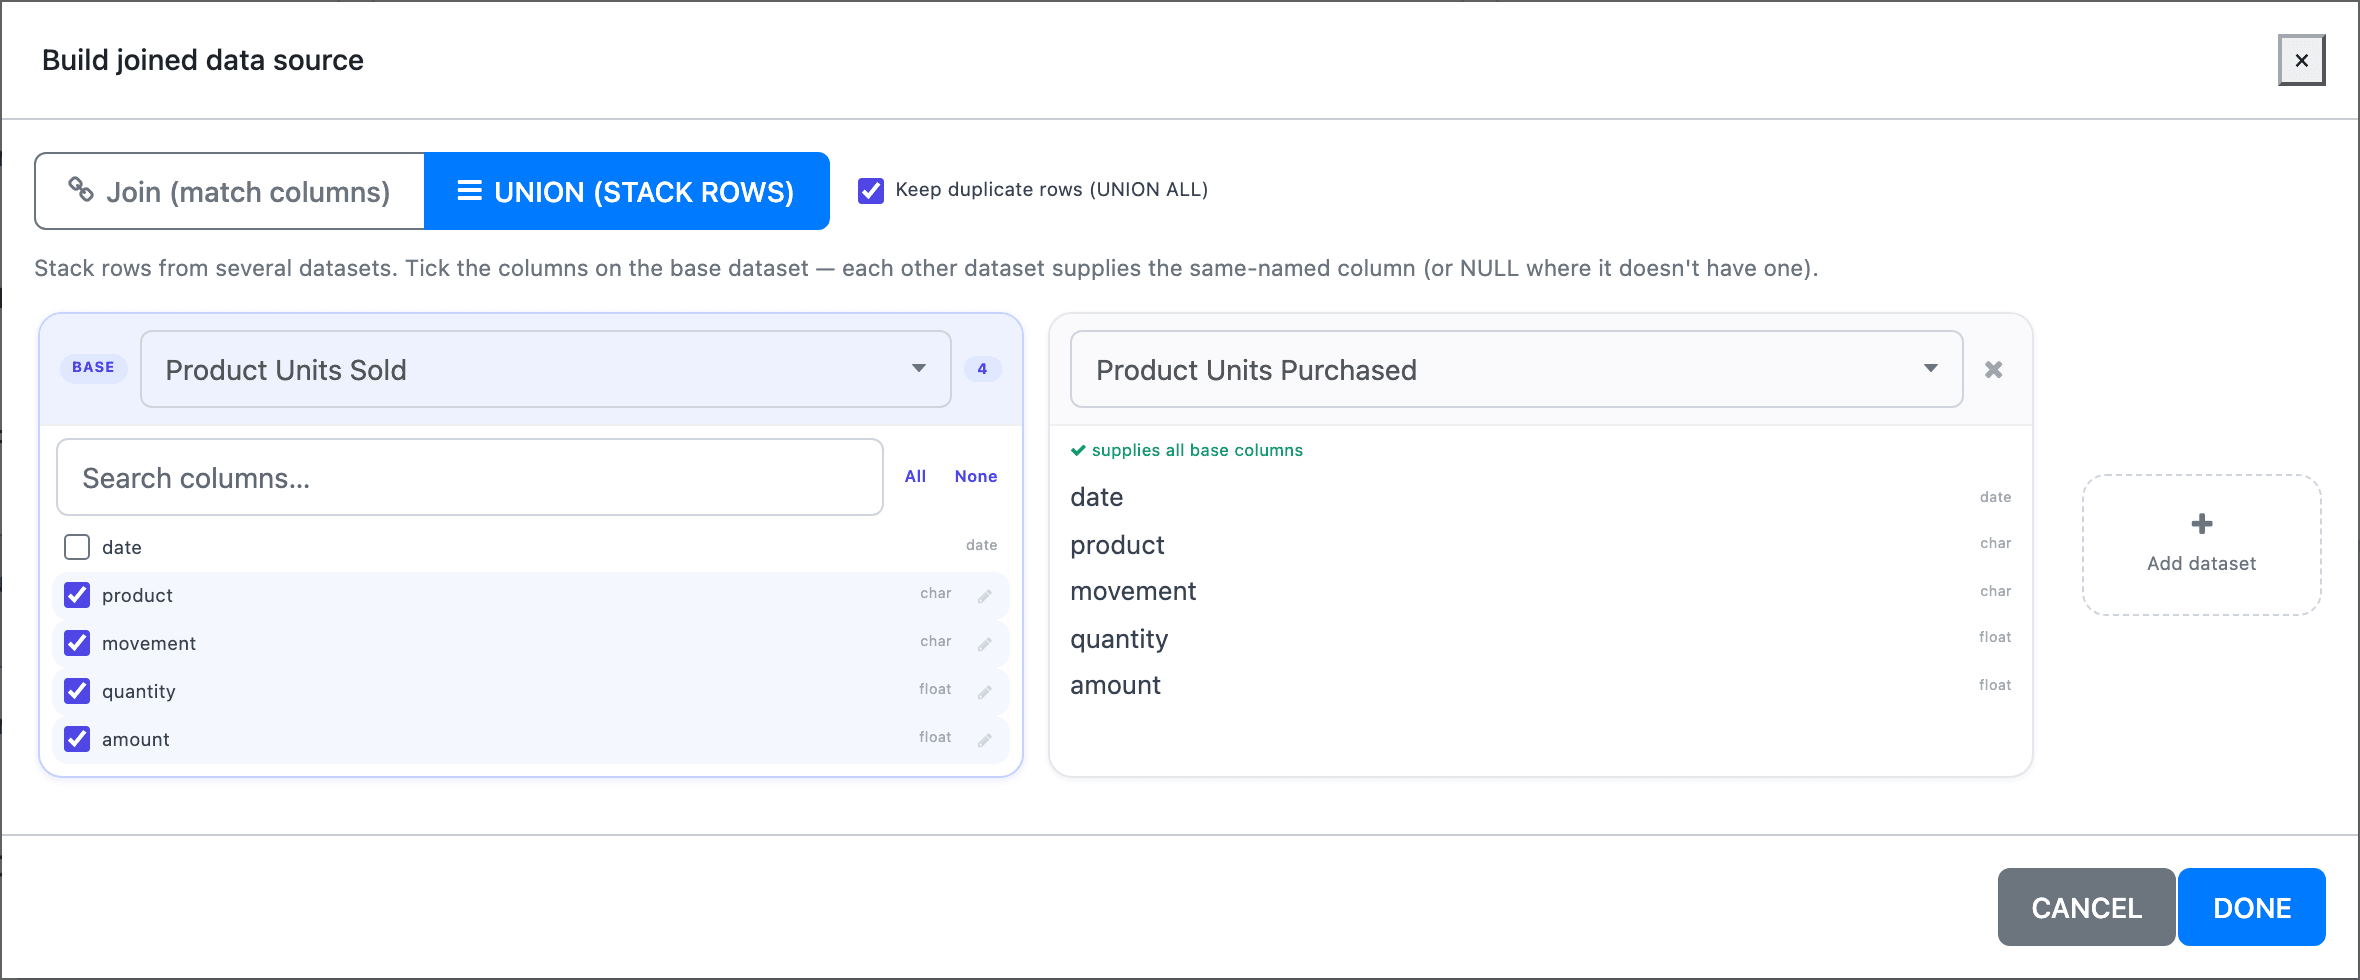
- Columns are matched by name. Each other dataset supplies the column with the same name as the base column, or an empty value where it has none; its card then lists them under Missing here → NULL. Give columns the same alias in each dataset before you build a union.
- Only the base card’s columns are ticked. They define the result.
- Keep duplicate rows (UNION ALL) is on by default and keeps every row. Untick it to drop rows that are identical in every column (UNION). For totals, keep it on: two identical sales lines are still two sales.
- Add a column that says where each row came from, like
movementhere, if the widget needs to tell them apart.
When joins fail
Section titled “When joins fail”The join is saved with the widget even if it can’t be built. You then see Join saved but not applied: followed by the reason. Common ones:
- Dataset ‘…’ uses runtime parameters and cannot be combined. Custom SQL datasets that use
{{date_from}},{{date_to}},{{as_at_date}}or{{int:…}}can’t take part in a join or union. - Could not build the combined view. Check that the columns line up (compatible types, matching names) and still exist. A key compares a number with text, or a column was renamed or removed from its dataset.
Good to know
Section titled “Good to know”- When a dataset in the chain is changed and regenerated, the widget’s combined view is rebuilt automatically.
- A dataset used in any join or union can’t be deleted until the widget stops using it.
- Drilldown and similar features use the Base dataset.
- The combination can’t be shared with other widgets. To reuse it, convert the table to a dataset.
Union Dataset on the dataset itself
Section titled “Union Dataset on the dataset itself”The Configure Dataset window of the Dataset Builder has a Union Dataset checkbox. It appends another dataset’s rows to this one for good, with UNION ALL. Columns are matched by position, not by name, so both datasets need the same number of columns in the same order with compatible types.