

Totals and % of group
Two features answer “how much in all?” and “how big a part of it?”: the totals row, and a share column built with the custom field wizard.
The totals row
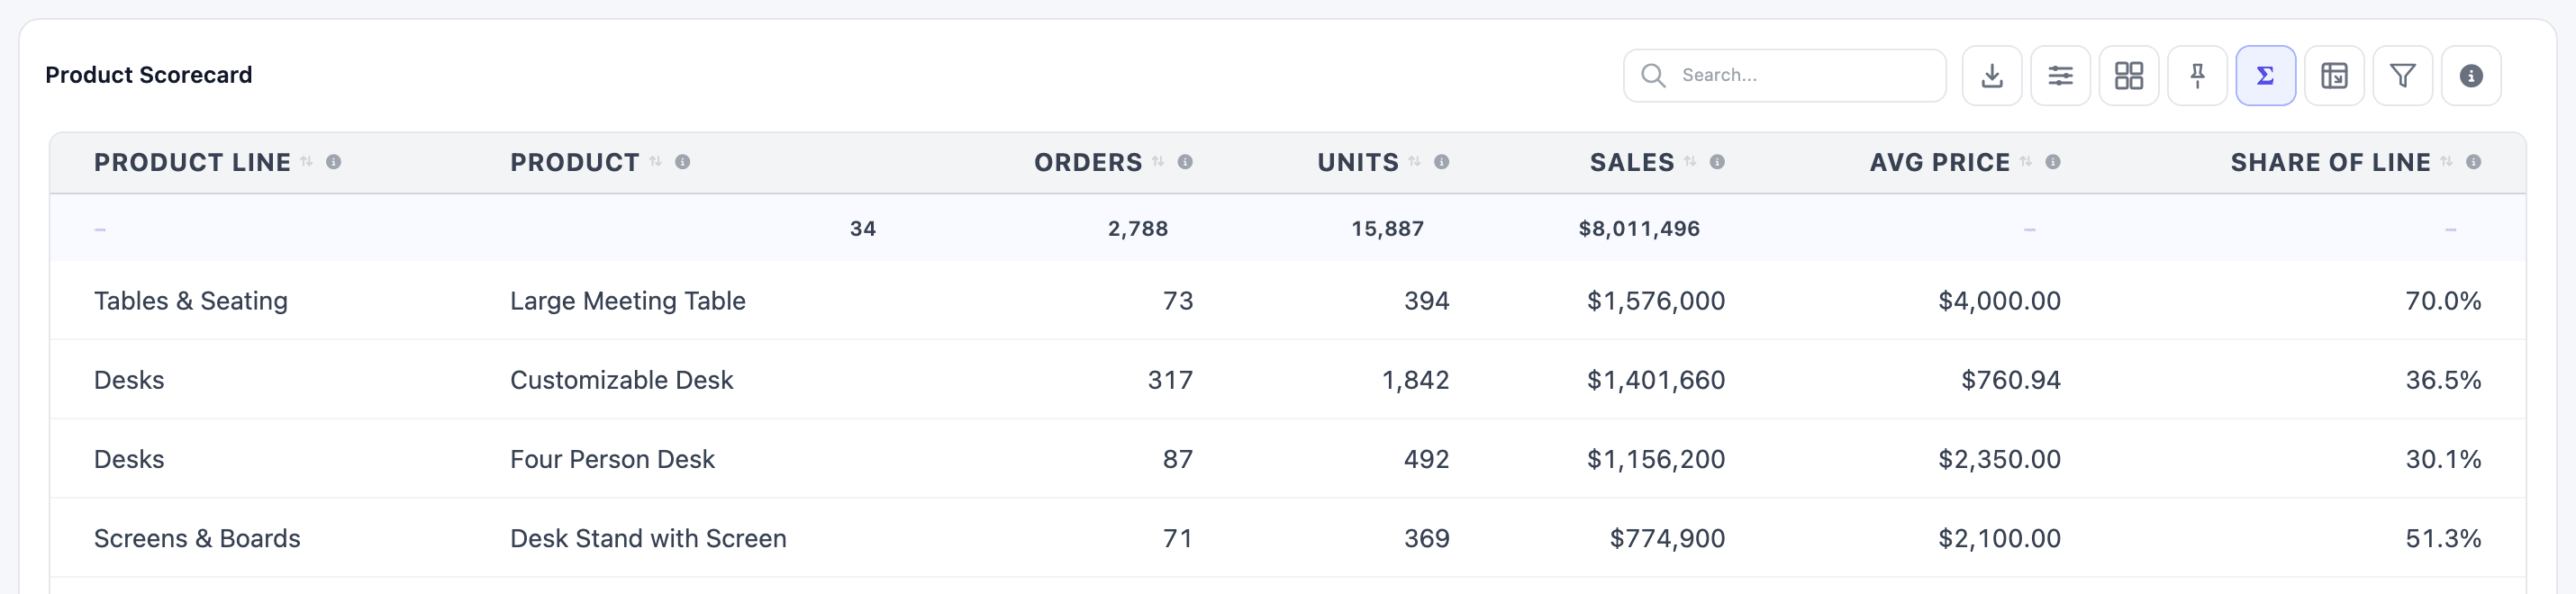
Section titled “The totals row”The totals row sits directly under the header, above the data, highlighted. It has no “Total” label because each column can summarise differently: Product Scorecard counts its products (34), sums orders, units and sales, and leaves the average price and the share blank.
Turn it on
Section titled “Turn it on”-
In the Dashboard Builder, select the table, open Configuration and expand Advanced.
-
Tick Show Totals, then click Save & Preview.
Viewers can also turn the row on and off with the Σ button (Show Totals) in the table’s toolbar. The button is highlighted while the row shows. Show Totals only decides whether the row is there when the table opens.
Choose what each column shows
Section titled “Choose what each column shows”By default, number columns are summed and text columns stay blank. To change that for a column, open its gear (Column settings), go to the Aggregation tab and set In the totals row, summarize using:
| Choice | Shows |
|---|---|
| Default (sum for numeric) | The sum for numbers, a dash for text |
| Sum, Average, Min, Max | That figure over the column’s numbers |
| Count | How many cells have a value. Works on any column. |
| Unique count | How many different values the column has, such as 34 products |
| None (leave blank) | A dash. Use it for ratios and percentages, where a sum is meaningless. |
In Product Scorecard, Product uses Unique count, Avg Price and Share of Line use None (leave blank), and the rest keep the sum.
Viewers can switch a total
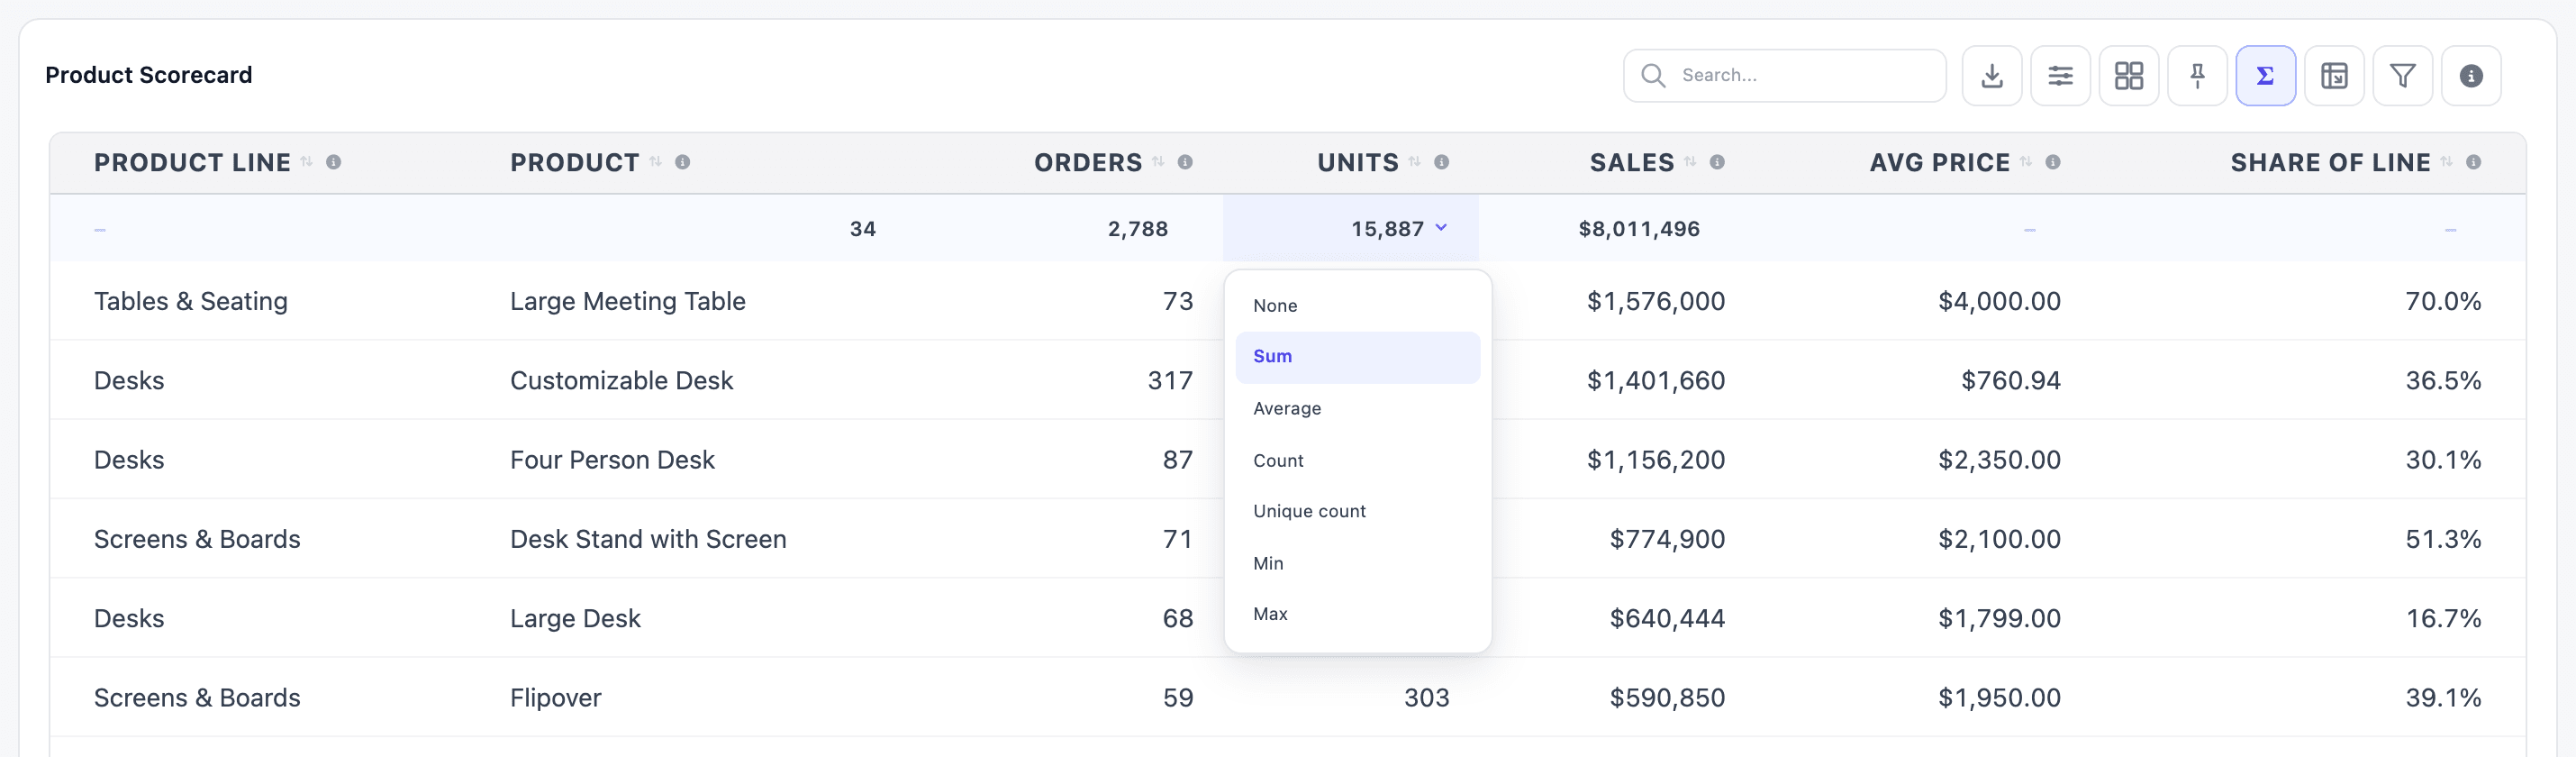
Section titled “Viewers can switch a total”Clicking a cell in the totals row opens a small menu: None, Sum, Average, Count, Unique count, Min, Max. The choice changes that cell for the viewer only, until the page reloads.
What the totals cover
Section titled “What the totals cover”- Every row that matches the current search and column filters, on all pages, not just the page on screen. Type “desk” in the search box and the totals follow.
- The values as they come from the database, before formatting.
- Hidden columns have no total.
- Grouping doesn’t change the totals row; each group row shows its own totals.
- The totals row is included when the table is exported, and isn’t shown while the table is transposed.
% of group: each row’s share
Section titled “% of group: each row’s share”A share column shows each row as a part of a whole: each product’s share of its product line, each customer’s share of total sales. It’s a custom field with the Percent of Total (Share) tool, available on tables only.
Product Scorecard has one, Share of Line: Large Meeting Table makes 70.0% of Tables & Seating sales, and Customizable Desk 36.5% of Desks.
-
Add a column (or select the one to change) and open its Field list. Choose Custom… at the bottom.
-
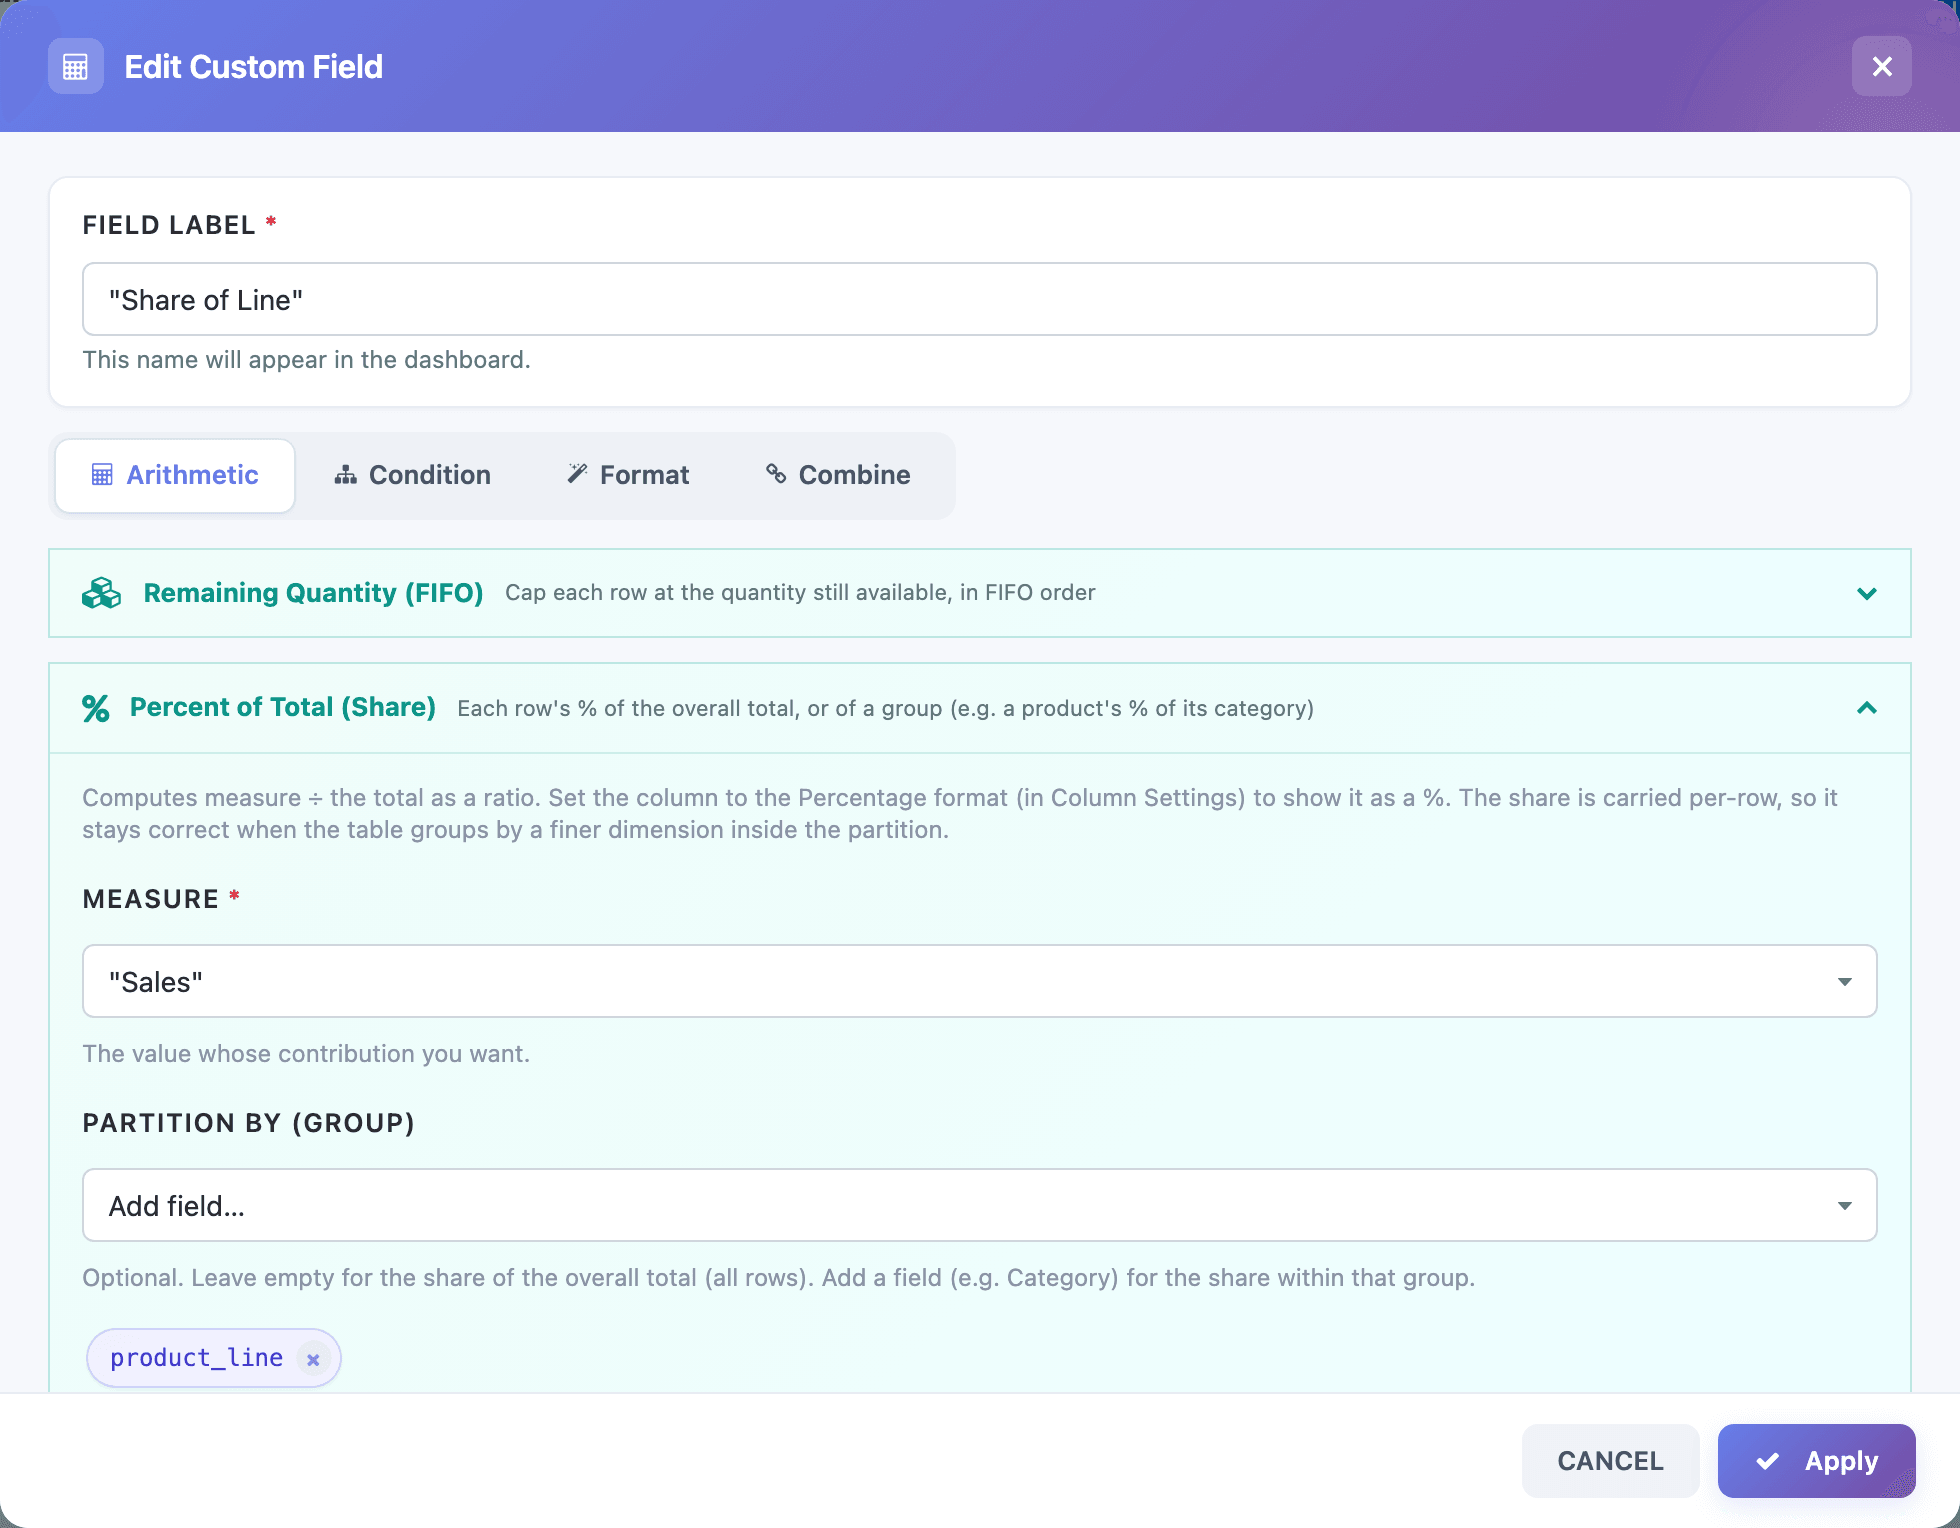
Type a Field Label, such as Share of Line.
-
Stay on Arithmetic and click Percent of Total (Share) to expand it.
-
In Measure, pick the value to divide up.
-
In Partition By (Group), add the field the share is within, for example
product_line. Leave it empty for each row’s share of the whole table. -
Click Apply.
-
Open the column’s gear (Column settings), choose Percentage on the Format tab with Multiply by 100 ticked, set the decimals, and click Apply.
-
Click Save & Preview.
Which Measure to pick depends on the table:
- Plain rows (no Group By): pick the number field itself, such as
sales_amount. - Summarised rows: pick the column that adds it up, such as the Sales column (
SUM(sales_amount)). Product Scorecard does this. Custom columns appear in the list under their label.
The tool produces a ratio, 0.70 for 70%, which is why the column needs the Percentage format.
Good to know:
- The share is worked out over the rows the table’s filters keep. Filter by a sales team and the shares are within that team.
- Viewers’ search and column filters don’t recalculate it: they hide rows, but each remaining row keeps its share of the full table.
- Because each row carries its own share, grouping the table and summing still gives the right answer. Grouping Product Scorecard by Product Line shows 100.0% on each line; with Partition By left empty, the group rows would show each line’s share of all sales.
- In the totals row, set None (leave blank) for this column. With a partition, the shares add up to 100% within each group, so a sum over the whole table means nothing.